What is a complex system? I like the definition provided by Professor Hiroki Sayama in his book Introduction to the Modeling and Analysis of Complex Systems:
“Complex systems are networks made of a number of components that interact with each other, typically in a nonlinear fashion. Complex systems may arise and evolve through self-organization, such that they are neither completely regular nor completely random, permitting the development of emergent behavior at macroscopic scales.”
This blog post will help you understand how to use Python and ABM to build a model of a complex system, namely the spread of infection that results from a single ‘patient zero.’ This post will use the following methodology:
- Install Python – download the COVID Simulation runtime environment, along with all the packages (such as Mesa ABM) you will need.
- Create the Modeling Environment – model the environment in which to run our simulation by defining:
- Parameters, such as infection, recovery, and death rate, etc
- Agents, such as those that become infected, those that recover, etc
- Data Collector, so we can keep track of each Agent
- Simulate Agent Movement – define how an Agent can move through the set of destinations in our environment.
- Model Agent Interactions – define how Agents can interact with other Agents.
- Collect Data – run the simulation a number of times in order to collect enough data to analyze the results.
Simulating Complex Systems Usecase: Simulating a COVID Infection
Using Mesa ABM as a framework, we are going to try to apply the theory behind the SIR (Susceptible, Infected, Recovered) model for disease spread. In this model we are going to create two classes: an environment (CovidModel), which contains a space where some Agents (CovidAgent) are going to move and interact with each other.
To create our model, we will:
- Include some simple behaviors in our Agents and let the result of their interactions show how, from a single infected Agent, the entire population can be at risk.
- Build the network of interactions to trace the spread.
- Run a series of experiments, changing the parameters for each execution of our model.
This is how our model will end up being represented:
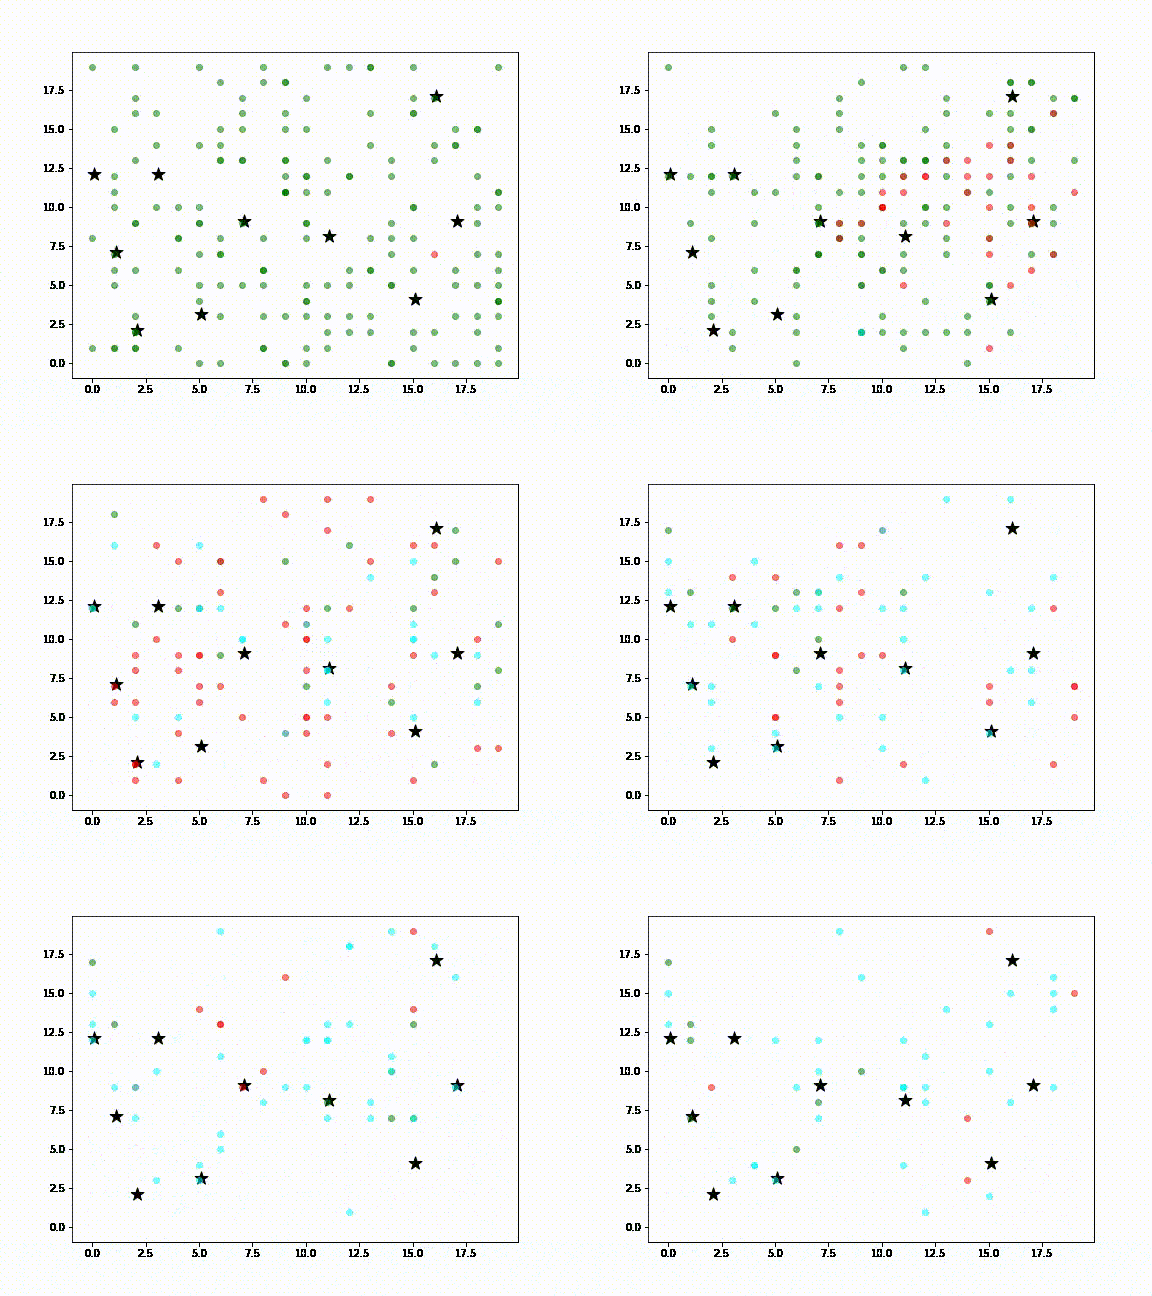
In the above diagram:
- Green dots are Agents (ie., people) susceptible to infection
- Red dots are infected Agents
- Cyan dots represent Agents that have recovered from infection
- Black stars are locations in a city, such as airports, supermarkets, sightseeing destinations, etc., meant to represent the kinds of places a visitor to New Zealand or locals might visit
It is assumed that non-infected Agents will, at some point, visit the places where the infected Agent has been (ie., the black stars). Death Agents are not shown.
Step 1 — Install Simulation Tools With This Ready-To-Use Python Environment
To follow along with the code in this Simulating Complex Systems tutorial, you’ll need to have a recent version of Python installed, along with all the packages used in this post. The quickest way to get up and running is to install the COVID Simulation runtime environment for Windows or Linux, which contains a version of Python and all the packages you’ll need to follow along with this tutorial.
In order to download the ready-to-use environment, you will need to create an ActiveState Platform account. Just use your GitHub credentials or your email address to register. Signing up is easy and it unlocks the ActiveState Platform’s many benefits for you!
For Windows users, run the following at a CMD prompt to automatically download and install our CLI, the State Tool along with the COVID Simulation runtime into a virtual environment:
powershell -Command "& $([scriptblock]::Create((New-Object Net.WebClient).DownloadString('https://platform.www.activestate.com/dl/cli/install.ps1'))) -activate-default Pizza-Team/COVID-Simulation"
For Linux users, run the following to automatically download and install our CLI, the State Tool along with the COVID Simulation runtime into a virtual environment:
sh <(curl -q https://platform.www.activestate.com/dl/cli/install.sh) --activate-default Pizza-Team/COVID-Simulation
Step 2 — Create a COVID Modeling Environment
Our environment stores a number of global parameters, including:
- Infection probability
- Incubation period of the disease
- Treatment period
- Death probability
In addition, the environment sets the way that our Agents are going to be able to move (ie., they can only move like a King in chess), as well as the limits of the environment (in our case, there are no limits since we’re modeling a toroidal world).
class CovidModel(Model):
   """A model with some number of agents."""
   def __init__(self, N, width, height, infection_prob, death_prob, incubation_period, treatment_period, sim_destinations, seed=None):
       self.num_agents = N
       self.grid = MultiGrid(width, height, True)
       self.schedule = RandomActivation(self)
       self.infection_prob = infection_prob
       self.death_prob = death_prob
       self.incubation_period= incubation_period
       self.treatment_period = treatment_period
       self.deaths = 0
       self.DG = nx.DiGraph()
       self.running = True
       #adds a fixed number of possible destinations
       self.destinations = []
       for idx in range(sim_destinations):
           self.destinations.append( (self.random.randrange(self.grid.width), self.random.randrange(self.grid.height)) )

       # Create agents
       for i in range(self.num_agents):
           x = self.random.randrange(self.grid.width)
           y = self.random.randrange(self.grid.height)
           a = CovidAgent(i, self, x, y, self.destinations)
           if i == 7:
               a.status = Status.INFECTED
               self.DG.add_nodes_from([(i,{"color": "green"})])
           else:
               self.DG.add_nodes_from([(i,{"color": "orange"})])
           self.schedule.add(a)
           # Add the agent to a random grid cell
           self.grid.place_agent(a, (x, y))

       self.datacollector = DataCollector(
	           model_reporters={"S": compute_S, "I": compute_I, "R": compute_R, "D": compute_D, "AvgDegree": compute_degree}
           ,agent_reporters={"Status": "status", "Position": "pos"}
           )
Besides initializing the global parameters, the init method also:
- Creates a set of possible destinations in the environment that will be concentration points for Agents (in ABM, the Agents interact between each other and also with their environment).
- Defines a data collector that stores the status and position for each Agent at any given point in time during the simulation. Globally, it stores the number of Susceptible (S), Infected (I), Recovered (R) and Death (D) Agents, as well as the average number of infections that Agents have caused at any given time.
Finally, the model infects the Agent identified with the id seven (7) before beginning the simulation. This will be our just arrived tourist, aka patient zero.
The following code adds two important methods that allow the environment to interact with the Agents:
def step(self):
   self.datacollector.collect(self)
   self.schedule.step()def addInfection(self, agentIdSrc, agentIdDes):
   self.DG.add_edge(agentIdSrc, agentIdDes)
The step method collects the values of the variables we configured for the status of each Agent, and computes the global values for each:
- compute_S – total number of susceptible Agents
- compute_I – total number of infected Agents
- compute_R – total number of recovered Agents
- compute_D – total number of death Agents
- Compute_degree – total number of infections caused
The step method then schedules a notification to each Agent so it can perform its designated behaviour on time.
The second function, “addInfection” creates an edge to the model’s network, effectively allowing us to link an Agent to its infecting Agent (ie., visualize who infected who). The result is a directed graph on which each node represents an Agent. We can use the graph to compute the out degree of each node (Agent) to know how many other nodes it has infected. The following code shows how the helper functions can calculate the model status at any point in time (ie., at each step):
def compute_S(model):
   agents = len([agent.status for agent in model.schedule.agents if agent.status == Status.SUSCEPTIBLE])
   return agents
def compute_I(model):
   agents = len([agent.status for agent in model.schedule.agents if agent.status == Status.INFECTED])
   return agents
def compute_R(model):
   agents = len([agent.status for agent in model.schedule.agents if agent.status == Status.RECOVERED])
   return agents
def compute_D(model):
   agents = model.num_agents - len(model.schedule.agents)
   return  agents
def compute_degree(model):
   degree = np.median([t[1] for t in model.DG.degree()])
   return degree
The initial state of our simulation is shown in the diagram below:
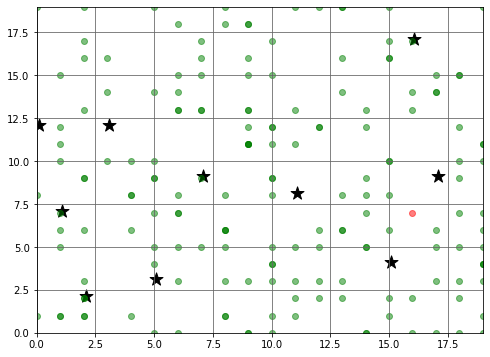
- Green dots represent the position of each Agent at the start of the simulation
- The stars represent the possible destinations for each Agent
- The red dot shows the starting position of the infected Agent (ie., patient zero)
Step 3 — Simulating COVID Agents
The second part of our model includes the entities that interact with the environment. There is only a single class of Agent in our model: CovidAgent. Just like in Object Oriented Programming, an agent has some attributes and some methods that define its state and behaviour under certain conditions.
class CovidAgent(Agent):
   """ An agent with fixed initial position and status."""
   def __init__(self, unique_id, model, xInit, yInit, destinations = []):
       super().__init__(unique_id, model)
       self.init_pos = (xInit, yInit)
       self.target_pos = None
       self.status = Status.SUSCEPTIBLE
       self.infection_time = 0
       self.destinations = destinations
       self.infected_at = 0
Our simulation includes:
- An init_pos or initial position, such as the hotel where our tourist patient zero is staying
- A target_pos or target position, which is where our Agents are going to move to before going back home/to the hotel
- An infection_time, which is the moment the Agent gets infected
- A set of possible destinations, which allows us to model the fact that not all Agents will go to the same place
Finally the infected_at attribute keeps track of the exact time in which the Agent was infected. Let’s check the way we have modelled the Agent’s behaviour:
def step(self):
       self.check()
       self.interact()
       self.move()def check(self):
   if self.status == Status.INFECTED:
       death_prob = self.model.death_prob
       np.random.seed = self.random.seed
       is_alive = np.random.choice([0,1], p=[death_prob, 1-death_prob])
       if is_alive == 0:
           self.model.schedule.remove(self)
           self.model.deaths += 1
       elif self.model.schedule.time - self.infected_at >= self.model.treatment_period:
           self.status = Status.RECOVEREDdef move(self):
   self.set_target_pos()
   possible_steps = self.model.grid.get_neighborhood(self.pos, moore=True, include_center=False)
   new_position = self.select_new_pos( possible_steps)
   self.model.grid.move_agent(self, new_position)
For each notification from the environment, the step method will:
- Check the status of the Agent
- Interact with other Agents that are in the same position
- Apply a set of movement rules
Checking the status of the Agent is simple:
- If an Agent is infected, it can die based on our death_probability parameter. In case of death, the Agent is removed from the environment, and the count of deaths in the environment is incremented.
- If the Infected Agent has survived for the entire treatment period, we set the status to RECOVERED.
To move an Agent, we need apply a couple of rules, as shown in the following code:
def set_target_pos( self ):
   #at home = select a random destination
   if self.pos == self.init_pos:
       self.target_pos = self.random.choice( self.destinations )
   #at destination
   elif self.pos == self.target_pos:
       self.target_pos = self.init_posdef select_new_pos( self, possible_steps ):
   if self.status == Status.INFECTED:
       has_symptoms = self.model.schedule.time - self.infection_time >= self.model.incubation_period
       # rule 1: infected with symptoms at home = stay at home
       if self.pos == self.init_pos and has_symptoms == True:
           return self.init_pos
       # rule 2: infected with symptoms not at home -> return to home
       elif self.pos != self.init_pos and has_symptoms == True:
           self.target_pos = self.init_pos   return self.calculate_new_pos( possible_steps )def calculate_new_pos( self, possible_steps ):
   next_step = possible_steps[0]
   next_dist = euclidean_dist(self.target_pos, next_step)
   for step in possible_steps:
       dist = euclidean_dist(self.target_pos, step)
       if dist < next_dist:
           next_step = step
   return next_step
- If the Agent is at home/hotel, it will leave and go to one possible destination
- If the Agent has reached a destination, it will now head back home
But we also want to add some intelligence to the movements. For example:
- If the Agent is infected and recognizes the symptoms, it will stay at home, or else immediately go back home before reaching its original destination.
- The path the Agent will take to its destination is computed using euclidean distances in order to ensure they always select the shortest path.
Step 4 — Modeling COVID Infection Interactions
Now that we’ve covered the check and move methods for our Agents, we also want to model their interactions with others. We’ll use the interact method to handle this possibility:
def interact(self):
   contacts = self.model.grid.get_cell_list_contents([self.pos])
   for c in contacts:
       if self.status is Status.INFECTED and c.status is not Status.INFECTED:
           infect = self.random.random() <= self.model.infection_prob
           if infect == True:
               c.status = Status.INFECTED
               c.infected_at = self.model.schedule.time
               self.model.addInfection(self.unique_id, c.unique_id)
The above code snippet does the following:
- First, it asks the environment for a list of all Agents located at the same position at the same time.
- For each Agent, we check if one or more of the Agents is currency infected:
- For each uninfected Agent, we check the model’s infection probability. In the case of infection, the status of the Agent is updated, and we set the infection time as the current step of the environment.
Finally, we notify the model to create the edge in the directed graph from the host to the target of the infection. In this way, we can model the usage of tracing apps that many countries have promoted to keep track of the population at risk.
Step 5 — Collect COVID Infection Data
Now that we have the environment and behavior for our simulation, it’s time to run it and see if the results of the data collected corresponds with the theory. The following code will parameterize and run the CovidModel one time:
maxX = maxY = 20
sim_steps = 100
sim_agents = 175
sim_infection_prob = 0.7
sim_death_prob = 0.05
sim_incubation_period = 3
sim_treatment_period = 14
sim_destinations = 10
sim_rand_seed = 4
model = CovidModel(sim_agents, maxX, maxY, sim_infection_prob, sim_death_prob, sim_incubation_period, sim_treatment_period, sim_destinations, seed = sim_rand_seed)
for i in range(sim_steps):
   model.step()
sir_df = model.datacollector.get_model_vars_dataframe()
Remember the init method of the CovidModel class? It includes a data collector that returns a pandas dataframe with the values of the calculated variables (S, I, R, D, AvgDegree) at each step of the simulation. The following chart shows the global behaviour for each variable over the 100 steps of our model:
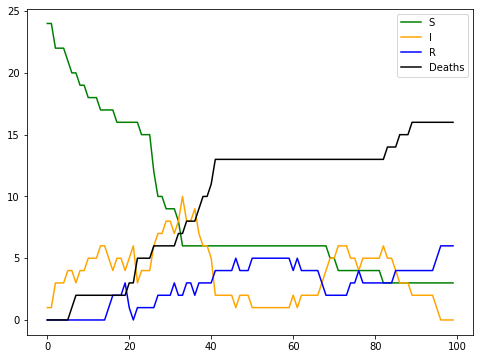
As you can see, the model describes a situation with two waves of infection (ie., the yellow line of Infected Agents has two peaks), and also indicates that Recovered Agents (ie., blue line) can be reinfected.
Simulating Complex Systems: Discovering Networks of COVID Infection
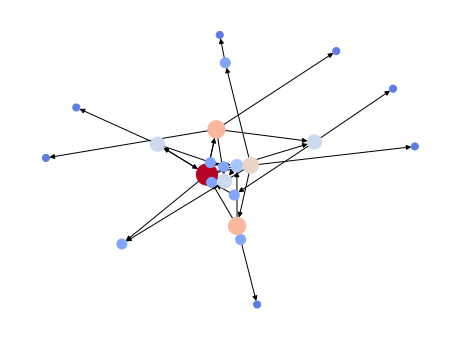
If you remember our definition of a complex system from the intro section of this Simulating Complex Systems turtorial, it states that complex systems are networks. For this reason, we have included in our simulation a directed graph that keeps track of the interactions that precede an infection.
The following graph shows a set of nodes (one per Agent), in which the size represents the number of infections caused by an Agent. Additionally, each node is colour coded to identify the most infectious nodes/Agents. Each edge represents an infected Agent, and can be traced back (following the arrow) to the infecting Agent. Tracing back all infections should reveal the most likely candidate for patient zero. Clearly, we have a winner:
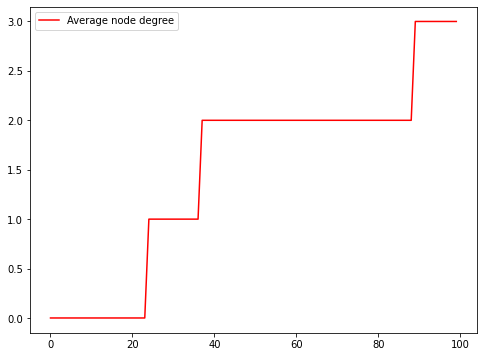
Also, we can calculate the average degree of the network over time. As you can imagine, the degree stabilizes at two (2.0), which is the period between the two infection waves. Our experiment also shows that there are reinfections because we see an increase in the average degree at the end of the simulation.
Simulating Complex Systems: Generating Data for Analysis
While executing the simulation once is instructive, it doesn’t give us enough information to analyze. We want to be able to easily run the model several times, varying specific parameters in order to check if it is consistent, and allowing us to validate the results in a more formal way. Mesa provides a BatchRunner class that helps in these situations:
ixed_params = {
	    "N" : 175
   ,"width" : 20
   ,"height" : 20
   ,"incubation_period" : 3
   ,"treatment_period" : 14
}
variable_params = {
	   "sim_destinations": range(3, 10, 1)
   , "infection_prob": [x / 10.0 for x in range(3, 8, 1)]
   , "death_prob": [x / 10.0 for x in range(2, 8, 1)]
}batch_run = BatchRunner(CovidModel,
                       variable_params,
                       fixed_params,
                       iterations=5,
                       max_steps=sim_steps,
                       model_reporters={"S": compute_S, "I": compute_I, "R": compute_R, "D": compute_D})
batch_run.run_all()
The batch_run object is initialized with the model that we want to run in two sets:
- One with the fixed parameters that we want to keep for all the executions
- One with the different values for all of our variables:
-
- The number of destinations will vary from three (3) to ten (10)
- Infection probability will vary from three (3) to eight (8)
- Death probability will vary from two (2) to eight (8)
At the end of the simulation, we can collect all the data for analysis. For example, the following chart shows the number of deaths occurring in all of the possible destinations:
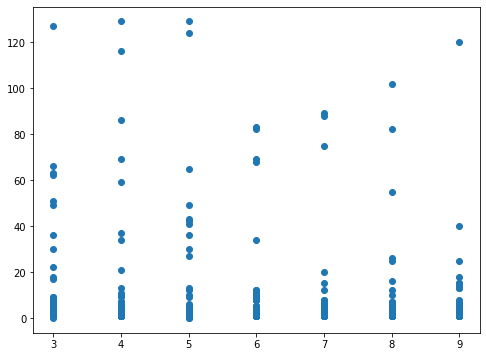
Using this configuration, we’ll get 1,050 executions of the model. The results will be collected in a pandas data frame so you can easily analyze them (I’ll leave the analysis to the reader).
Simulating Complex Systems: Conclusions
While still fairly involved, the model created in this post does not include all the elements of a formal simulation. However, it does serve to introduce the basic ideas that you’ll find in just about any real-world simulation. And the rich environment we’ve created here will help you familiarize yourself with Python’s modeling tools, such as ABM.
- The complete code for this simulation is available as a Jupyter Notebook in my Github repository.
- If you want to learn more about how to model complexity, the book from Professor Sayama is available here.
- If you want to check out a real model for COVID infections built using ABM, check the work of Professor Pietro Terna, which includes more details and complex behaviours.
There are many insights to be gained in the pandas dataframe, as well as many parameters that can be tweaked to better model outcomes. To get started with your own simulation and analysis, sign up for a free ActiveState Platform account so you can download our COVID Simulation runtime environment and get started faster.
Related Reads
Will AI Save Us? Use this Pandas Data Analysis Tutorial to find out.
How to monitor social distancing using Python and object detection


