For programmers, one of the most common questions posed is “Why is my application taking so long?” For dynamic programming languages, there are often limited tools that can answer this important question, or variant questions like:
- Where is my application spending the most CPU time?
- How many times is this function getting called?
- By changing X to Y, what performance impact will this have?
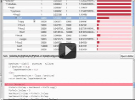
With Komodo IDE 7 (currently Alpha 4 – available at the bottom of the download page), Python programmers will now be able to answer these questions using the new Code Profiling tools. You can easily launch your application with code profiling enabled, and when the application finishes, Komodo IDE will show you a graphical representation of the code profiling results. This will allow you to easily see exactly where your program spends most of it’s time, showing which functions were called and which functions called what other functions, how many times they were called and how long they took to execute.
Armed with this knowledge, you’ll be able to quickly trace your applications, tweak your code and then re-run them, comparing the performance results to your previous runs.
Note: As of 7.0.0 Alpha 4, Komodo IDE’s Code Profiling launcher only supports Python, though you can open standalone profiling results that are stored in the callgrind format, which is a common profiling format used in other dynamic languages.


