From time to time, all of us run up against the limitations of our tools. In the old days, you’d put in a feature request and NOT hold your breath waiting for it to get implemented. Today, most products and services expose an API, so if you need to, you can add the missing functionality yourself.
Asana API, Integrations & Scripting
Take the product management (PM) functionality in Asana, for instance. It provides you with a set of primitives to get your PM work done, as well as collaborate with others. But more importantly, it also has a full fledged API and a library of free integrations with other products and services. This makes it possible to write your own script if you really need to add key, missing functionality.
Writing your own script might sound more painful than finding a solution that already has the feature you need, or even just manually implementing it with whatever tools you currently have. But I’m here to demonstrate that the Rolling Stones were correct: you can’t always get what you want, but (with the power of AWS’ lambda functions, as well as some quick scripting), you just might get what you need.
Tracking Customer Feature Requests
What I needed was quite simple: a way to visualize which features are the most requested by customers and prospects versus which features are more niche.
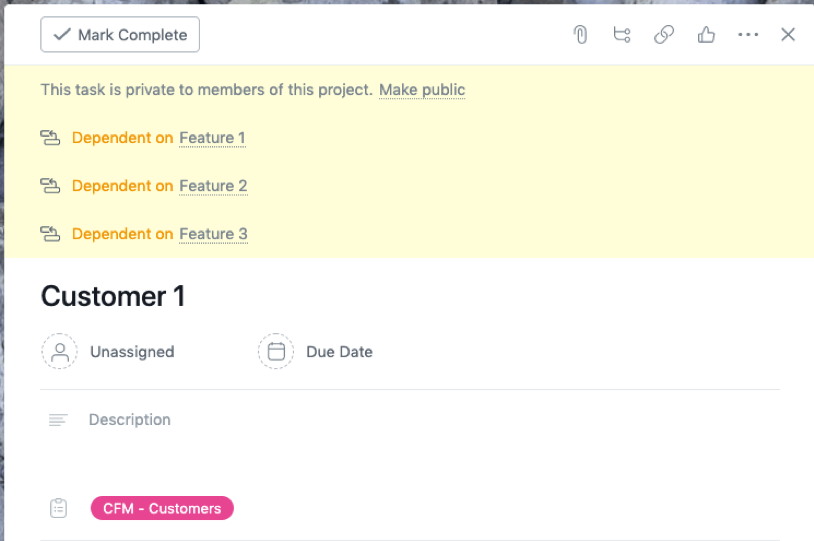
Additionally, I needed a way to see which customers requested which features. By default, the Asana UI shows which features a task depends upon, but no easy way to visualize which prospects “depend on” the implementation of the feature.

I could optionally use Asana’s timeline view, which provides visualization of all dependencies. But this requires setting time ranges for features that haven’t been locked down yet, and will likely result in more confusion than clarity.
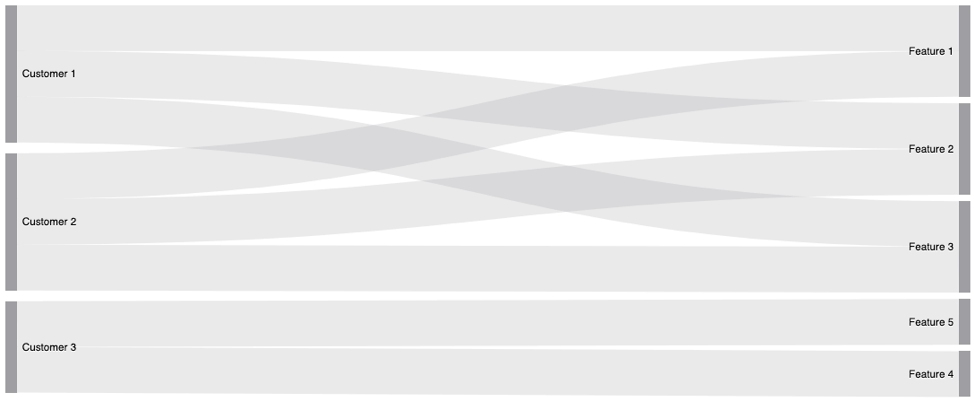
To my mind, the best visualization for my purposes is a Sankey diagram with clients on the left and features on the right. A Sankey diagram is one in which the width of the flow is proportional to the quantity. For example, in the diagram below, Feature 1 is requested by two customers and is twice as wide as Feature 5, which is only requested by one customer. The flow also shows which 2 customers are requesting Feature 1, for example.

How to Add Sankey Diagrams to Asana
Visualizing customer-weighted features in Asana requires a number of steps:
- Find a workable Sankey diagram implementation
- Extract the required dependency data from the Asana API, and format the data for use in a Sankey diagram
- Generate the diagram on a published web page
- Add links to the web page for each affected Asana project
Step 1: Sankey Diagrams in JavaScript
Sankey diagram implementations are available in many JavaScript libraries today. I’m going to be using D3.js, but it should be as easy to implement using any other library you may prefer. The Sankey code I’ll be using is from wvengen’s Github repo, but modified to include clickable nodes, as follows:
<!DOCTYPE html>
<html>
  <head>
    <meta charset="utf-8">
    <title>d3.chart.sankey (product demo)
    <script src="//d3js.org/d3.v3.min.js">
    <script src="//cdn.rawgit.com/newrelic-forks/d3-plugins-sankey/master/sankey.js">
    <script src="//cdn.rawgit.com/misoproject/d3.chart/master/d3.chart.min.js"></script>
    <script src="//cdn.rawgit.com/q-m/d3.chart.sankey/master/d3.chart.sankey.min.js">
    <style>
      body {
        padding: 10px;
        min-width: 600px;
        max-width: 1200px;
        margin: auto;
      }
      #chart {
        height: 500px;
        font: 13px sans-serif;
      }
      .node rect {
        fill-opacity: .9;
        shape-rendering: crispEdges;
        stroke-width: 0;
      }
      .node text {
        text-shadow: 0 1px 0 #fff;
      }
      .link {
        fill: none;
        stroke: #000;
        stroke-opacity: .2;
      }
    </style>
  </head>
  <body>
    <div id="chart"></div>
	    <script>
      var colors = {
      'fallback':            '#9f9fa3'
      };
      var chart = d3.select("#chart").append("svg").chart("Sankey.Path");
	        d3.json('data.json',function(data){
         chart
          .name(label)
          .colorNodes(function(name, node) {
            return color(node, 1) || colors.fallback;
          })
          .colorLinks(function(link) {
            return color(link.source, 4) || color(link.target, 1) || colors.fallback;
          })
          .nodeWidth(15)
          .nodePadding(10)
          .spread(true)
          .iterations(0)
          .draw(data);
          chart.on('node:click', followNodeURL)
      });
      function followNodeURL(node) {
       window.open(node.url,'_blank')
      }
      function label(node) {
       return node.name.replace(/\s*\(.*?\)$/, '');
      }
      function color(node, depth) {
       var id = node.id.replace(/(_score)?(_\d+)?$/, '');
       if (colors[id]) {
         return colors[id];
       } else if (depth > 0 && node.targetLinks && node.targetLinks.length == 1) {
         return color(node.targetLinks[0].source, depth-1);
       } else {
         return null;
       }
      }
	      </script>
  </body>
</html>
Now that we have some HTML for our web page, I’ll place it in an S3 bucket for later use.
Step 2: Extracting Diagram Data
The data required to drive a Sankey diagram needs to be in the following format:
{
    'links':[
        {'source': 0, 'target': 1, 'value': 1},
        {'source': 0, 'target': 2, 'value': 1}
    ],
    'nodes':[
        {
            'id': ,
            'name': 'Customer 1',
            'url':
        },{
            'id': ,
            'name': 'Feature 1',
            'url':
        },{
            'id': ,
            'name': 'Feature 2',
            'url':
        }
    ]
}
To extract this data, I wrote a small Python script that queries the Asana API, retrieves the data, and then renders it into the required format:
import json
import logging
import sys
from botocore.vendored import requests
import boto3
from functools import partial
logger = logging.getLogger()
logger.setLevel(logging.INFO)
handler = logging.StreamHandler(sys.stdout)
handler.setLevel(logging.INFO)
logger.addHandler(handler)
ASANA_BASE_URL = 'https://app.asana.com/api/1.0'
ASANA_UI_BASE_URL = 'https://app.asana.com/0'
CUSTOMERS_PROJECT_ID = YOUR_ASANA_CUSTOMERS_PROJECT_ID
FEATURES_PROJECT_ID = YOUR_ASANA_FEATURES_PROJECT_ID
DATAFILE_NAME = 'data.json'
AWS_BUCKET = YOUR_AWS_BUCKET
asana_get = partial(requests.get, headers={'Authorization': YOUR_ASANA_BEARER_TOKEN})
customer_ids = set()
customers = dict()
feature_ids = set()
features = dict()
links = list()
s3_resource = boto3.resource('s3')def make_node_json(asana_task_json, asana_project_id):
    task_id = str(asana_task_json['id'])
    return {
        'name': asana_task_json['name'],
        'id': task_id,
        'url': '/'.join([ASANA_UI_BASE_URL, asana_project_id, task_id])
    }
	def lambda_handler(event, context):
    # In Customer project, read all the customer cards into Set
    customers_response = asana_get('/'.join([ASANA_BASE_URL, 'projects', CUSTOMERS_PROJECT_ID, 'tasks']))
    # For each customer card
    # determine features that the customer is waiting for
    # add features to Set
    # add customer-feature links to Array
    for customer_json in customers_response.json()['data']:
        customer_ids.add(customer_json['id'])
        customers[customer_json['id']] = make_node_json(customer_json, CUSTOMERS_PROJECT_ID)
        features_response = asana_get('/'.join([ASANA_BASE_URL, 'tasks', str(customer_json['id']), 'dependencies']))
        for feature_json in features_response.json()['data']:
            if feature_json['id'] not in feature_ids:
                feature_ids.add(feature_json['id'])
                features[feature_json['id']] = make_node_json(feature_json, FEATURES_PROJECT_ID)
            links.append((customer_json['id'], feature_json['id']))
			    # merge Set and Set into Array
    nodes_dict = {**customers, **features}
    nodes_list = list(nodes_dict.values())
    dereferenced_links = map(
        lambda link: (nodes_list.index(nodes_dict[link[0]]), nodes_list.index(nodes_dict[link[1]])), links)
    augemented_links = map(lambda x: {'source': x[0], 'target': x[1], 'value': 1}, dereferenced_links)
    # build dataset from Array and Array
    result = {'nodes': nodes_list, 'links': list(augemented_links)}
    # push datafile to S3
    with open(DATAFILE_NAME, 'w') as datafile:
        json.dump(result, datafile)
    s3_resource.Bucket(name=AWS_BUCKET).upload_file(Filename=DATAFILE_NAME, Key=DATAFILE_NAME)
	if __name__ == '__main__':
    lambda_handler(None, None)
Step 3: Generate the Diagram
To generate an iteration of the Sankey diagram, I’ll use the Python script to pull the data from Asana and populate the web page from Step 1.
To that end:
- I created a lambda function on AWS using a Python 3.6 runtime, and pasted my Python code into it.
- I modified a permission set for this lambda function in order to give it write access my S3 bucket from Step 1.
- You’ll also need to add a simple trigger for the lambda function. There are a number of options here:
- Trigger on a schedule (e.g. every hour)
- Trigger by visiting a certain webpage (on demand)
- Trigger by Asana webhook
Choose whichever is more appropriate for your implementation.
Step 4: Link the Web Page to Asana
Now that we have a script that regenerates the client-to-feature(s) mapping data on a certain schedule, as well as a page that generates a Sankey diagram based on the results, all we need to do is link it back to Asana in order to make it easy for Asana users to get at. For my purposes, I’m simply going to add a link to the Sankey diagram page to both customer and feature project descriptions.
And that’s it! Hopefully, this blog post has shown you how easy it is to extend the functionality of Asana using Lambda and Python. When it comes to extensibility, Python is key not only for scripting, but also for creating APIs.
To learn more about Python and application extensibility, you can get:
- Our Altair Case Study – learn how Python can make software solutions more extensible by customers
- ActivePython – download and automatically install Python into a virtual environment using the State Tool and try it out for yourself!
Related Reads:


