- Optimizing navigation paths, such as shipping routes
- Modeling complex networks, such as social networks
- Modeling the spread of infectious diseases, such as COVID
- Identifying instances of fraud in financial transactions
Many of these cases lend themselves to a Machine Learning (ML) approach since they require analyzing a huge amount of data in real time. Those looking to explore graph theory should familiarize themselves with:
- The kinds of graph algorithms currently available.
- How to convert raw data into the proper format for graph algorithms.
- Understand the software tools available for use with graphs.
This post will explain the basics of graph theory, and show you how to implement graphs using Python and packages like NetworkX and Matplotlib.
What Is Graph Theory?
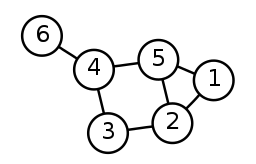
Simply put, graph theory is the study of the relationships between objects. These relationships are typically represented as graphs. A graph, in other words, is a mathematical representation of a collection of objects, with some object pairs connected by links. It is possible to represent connected objects using their nodes (which are also known as points or vertices), and the relationships between them using the edges of those relationships (also called arcs or links), such as the following simple graph with 6 nodes:
One of the most important properties of graphs is that they are quite flexible data structures. They’re often just abstractions of the real world, and they can be used to solve several types of problems, as noted above.
The Basics of Graph Theory
Graphs can have an infinite variety of shapes and sizes which are consistently specified by a set of properties that describe unique graph attributes. There are several fundamental terms used in graph theory, including:
- Point: A point is a distinct location in one-, two-, or three-dimensional space. The points on a graph can be represented by dots and labeled with alphabetical, numerical, or alphanumeric values.
- Line: A line is a connection between two points. It can be represented by a solid line.
- Vertex: A vertex, also called a node, is a point where multiple lines/edges connect. A vertex can be denoted by alphabetical, numerical, or alphanumeric values.
- Edge: “Edge” is a mathematical term for a line that connects two vertices in a graph. An edge can be either directed (meaning that it points from one vertex to another) or undirected (meaning that it has no direction).
- Graph: A graph is defined as G = (V, E), where V is a set of all vertices and E is a set of all edges in the graph. Simply put, a graph is a plot that depicts a collection of connected subsets of points and lines.
- Loops and Multiple Edges: A loop is an edge that joins a vertex to itself. Multiple edges are found in graphs that connect pairs of vertices with more than one edge.
- Degree of a vertex: The degree of a vertex is the number of edges that intersect at that vertex.
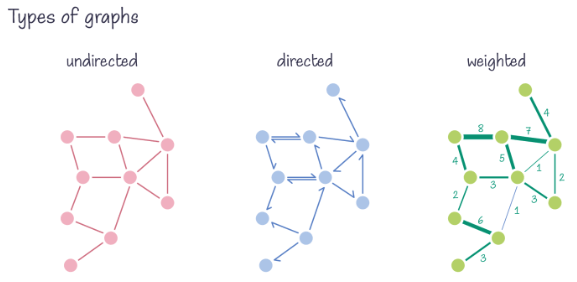
Furthermore, there are three primary types of graphs:
- Undirected – has edges but no directionality. Best for modeling objects that have reciprocal relationships, such as friending on Meta/Facebook.
- Directed – has edges with specific orientations. Best for modeling objects that have relationships in only one direction, such as the spread of a disease from an infected person to non-infected persons.
- Weighted – has numerical assignments to each edge. Best for modeling objects that have a likelihood of reciprocal relationships, such as when one person follows another on a social network, which is likely to result in a follow-back.
How to Implement Graph Theory in Python
To help you get acquainted with graphs in Python, we will create and visualize a sample graph using a Python package called NetworkX. NetworkX can be used to create, alter, and study the structure, dynamics, and operations of complex networks. You can find NetworkX’s documentation here.
Before you begin, make sure that you’ve installed the Graph Theory Python runtime environment, which contains a version of Python 3.10 and all the packages you’ll need installed into a virtual environment, ready to run.
In order to download and install this ready-to-use Python project, you will need to create a free ActiveState Platform account. Just use your GitHub credentials or your email address to register. Signing up is easy and it unlocks the ActiveState Platform’s many other dependency management benefits.
Or you can also use our State tool CLI to install the Graph Theory Python runtime environment:
For Windows users, run the following at a CMD prompt to automatically download and install the Graph Theory Python runtime and project code into a virtual environment:
powershell -Command "& $([scriptblock]::Create((New-Object Net.WebClient).DownloadString('https://platform.www.activestate.com/dl/cli/_pdli01/install.ps1'))) -c'state activate --default Pizza-Team/Graph-Theory"
For Linux users, run the following to automatically download and install the Graph Theory Python runtime and project code into a virtual environment:
sh <(curl -q https://platform.www.activestate.com/dl/cli/_pdli01/install.sh) -c'state activate --default Pizza-Team/Graph-Theory'
Ready? Let’s go. To create a graph in Python, you’ll first import the NetworkX package, then use it to instantiate a graph instance. After that, you’ll continue adding nodes and edges, as outlined below.
Step 1: Import the NetworkX and Matplotlib.pyplot packages in the project file:
#importing networkx
import networkx as nx
#importing matplotlib.pyplot
import matplotlib.pyplot as plt
Step 2: Create a graph using NetworkX.
Step 3: To draw the graph, use the network’s draw() function.
Step 4: Save the drawn graph in the “filename.png” file using Matplotlib’s savefig(“filename.png”).
The complete Python code for your graph will look like this:
#Create a Graph
G = nx.Graph()
#add a node
G.add_node(1)
G.add_nodes_from ([2,3,4,5])
#add edges
G.add_edge(1,2)
e = (2,3)
G.add_edge(*e) # the * unpacks the tuple
G.add_edges_from([(1,2),(1,3),(2,4),(2,5)])
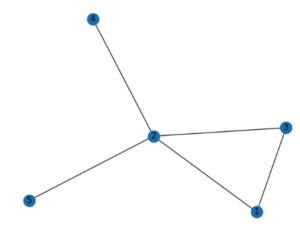
nx.draw(G, with_labels =True)
plt.savefig("basicgraph2.png")
And the output will look like this:
Conclusion
This article only scratches the surface when it comes to the fascinating field of graph theory. Graph theory can greatly enhance your network modeling and analysis of everything from biological to social to computer sciences. Some of the ways it can directly aid in your current efforts include:
- Finding the shortest path through a network, as well as guaranteeing the fastest possible processing time.
- Database optimization (see graph databases for more info)
- Social network mediation by mapping collaboration patterns using Social Network Analysis (SNA).
- Detecting anomalies by spotting insightful patterns within any activity flow.
If these graph concepts are of interest to you, you’ll want to get familiar with Python and key machine learning packages like NetworkX, pandas, NumPy, and Matplotlib.
Next steps:
Download and install the Graph Theory Python runtime environment in order to learn more about how to work with graph theory in Python.
Read Similar Stories

Learn about the top 10 machine learning algorithms that can save a developer’s day.
Learn more >

Automate many of the most time and resource consuming machine learning tasks with these 10 packages.
Learn More >

Learn how to automate the labeling of data for your machine learning projects.
Learn More >


