In many arenas of computing, speed is the name of the game. Being able to
compute quickly, generate results immediately, and fetch data instantly are key
objectives for mission-critical software products. As code bases grow in size,
it is often difficult to identify bottlenecks, the places in software where the
most CPU time is spent, and optimize them in order to get that little extra bit
of speed. As algorithms get more complex, it is often difficult to determine at
a glance which is better suited in a production environment. Fortunately, Komodo
IDE is here to help.
Komodo IDE comes with a built-in code profiler for many of its supported
languages. Invoking it is as simple as these three steps:
- Load up your application’s source code entry point (typically the main method)
- Open the “Debug” menu
- Select “Start Code Profiling”
You will be prompted with the usual Debug/Run dialog, only this time, after your process finishes, Komodo will present you with a dialog that shows a detailed account of how much time was spent in each chunk of your code. Using the drill-down interface, you can quickly identify the bottlenecks that need attention and fix them. Similarly, you can benchmark different algorithms and figure out which one performs the best.
Identifying Bottlenecks
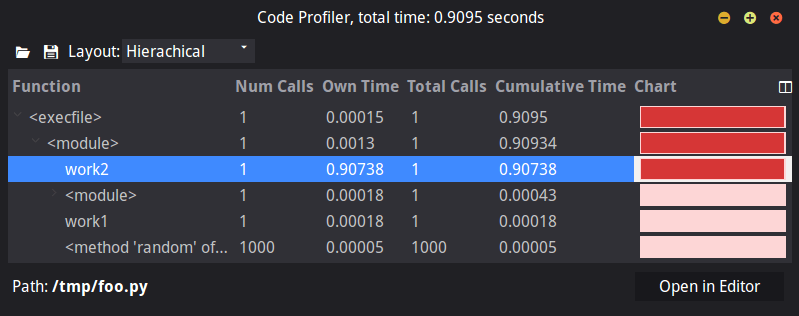
Komodo’s profiler makes it incredibly easy to spot bottlenecks with its graph
view. Consider this profiler result:

It is quite clear that in this small script where work is being distributed over
two methods, the `work2()` method is consuming an inordinate amount of CPU time
compared to `work1()`. Therefore attention should be focused on optimizing the
routines in `work2()` as opposed to the routines in `work1()`. After the
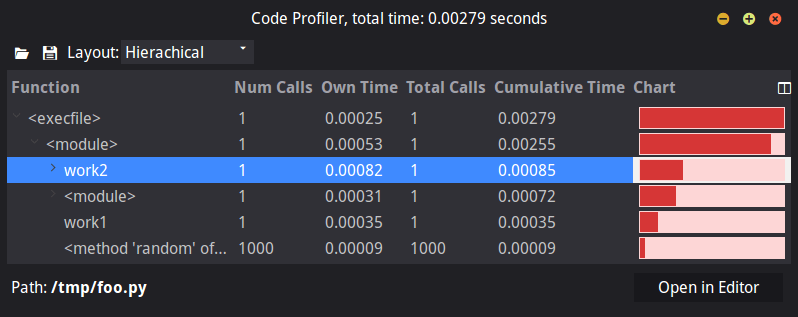
optimization, Komodo’s profiler might report something like this:

Much better. Even though `work2()` is still slower than `work1()`, the
difference in compute time between them has been drastically reduced.
Benchmarking Algorithms
Komodo’s profiler can also be used to quickly benchmark algorithms. This may be
quite helpful in a number of situations, such as when you are not sure which
algorithm to put into a production system.
Back in your early days of coding, you were told that repeated string
concatenation is expensive. But just how expensive is it? We can leverage Komodo
to help determine the answer.
Consider the following Python code:
def inefficient(strs):
result = ""
for s in strs:
result += s
return result
def more_efficient(strs):
return "".join(strs)
strs = [str(i) for i in xrange(1000000)]
inefficient(strs)
more_efficient(strs)
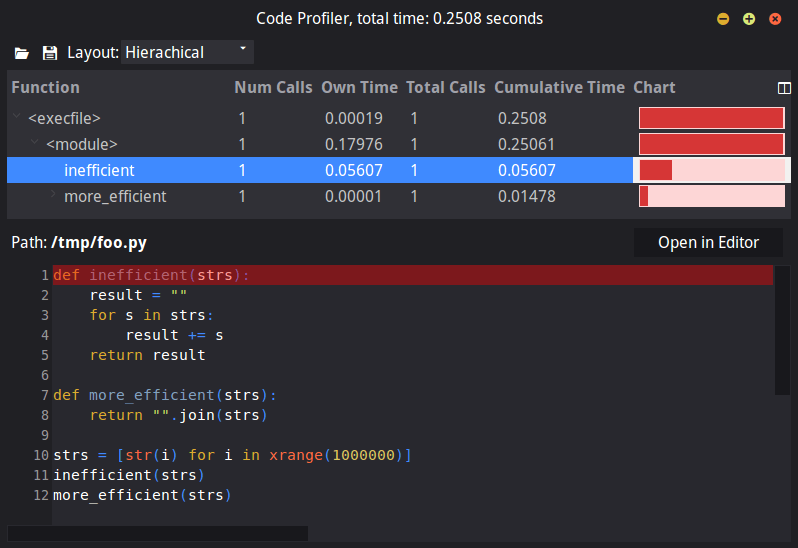
Komodo’s profiler allows us to visualize how much more expensive `inefficient()`
is than `more_efficient()`:

Clearly the `more_efficient()` algorithm is better-suited for production.
Conclusion
When application speed is critical, Komodo IDE’s profiling tools rise to the
challenge, aiding developers in easily identifying bottlenecks in their existing
code and helping them determine which algorithms are best-suited for primetime.
Not only can you use Komodo to profile code in real-time, but you can also run
your own profiling code outside of Komodo, save that data to a file, and then
have Komodo load, process, and visualize the results. For more information,
please visit http://docs.komodoide.com/Manual/profiling.


