Komodo has always been a very fast IDE. So much so that combined with its minimalistic UI many users tend to confuse Komodo IDE with an editor. Of course Komodo is an editor too, but to call it just an editor would be doing it a disservice.
But as fast as Komodo has always been, it inevitably got a bit slower over the years. For example typing has always been instant, but after using Komodo for a whole day you could start to notice some delay. Similarly file opening, switching and closing was snappy and fast, until you got to the point where you were working with 20+ files, then it would start to slow down a little. And applying color schemes could take anywhere from a few seconds to a full minute depending on how many files you had open.
All of these performance issues were annoying users and Komodo developers alike, and with Komodo X we decided to dedicate a significant amount of time to hunt them down.
Finding the Bottlenecks
The first step in speeding up our code would be to analyze the code and find out where the performance is bottlenecked. This is easier said than done; it’s not like code has some sort of built-in performance analyzer that shows you exactly what it is doing and how long it’s taking to do it…except that it does! This is where code profiling comes into play, something Komodo itself has various levels of support for (both in creating profiling reports and analyzing them). But Komodo has so many moving parts it becomes quite a challenge. Not only does it have JavaScript code running on the frontend, it also has Python code running on the backend, and this Python code runs on different threads and in some cases even in different processes. Making sense of all this is a challenge.
Profiling Javascript
Komodo is based on Mozilla, which luckily has a large amount of developer tools. One of these tools is Cleopatra, which is a web based tool that will analyze profiling reports generated by Mozilla’s profiler tool.
You might be wondering – why couldn’t I use Komodo’s built-in profiler tool? Well unfortunately Mozilla decided to roll their own format for the profiler reports, which Komodo does not support. Komodo’s profiler tool only supports standardized formats such as cachegrind.
Before I could start analyzing the profiling report I would have to generate it. For this I could use @mozilla.org/tools/profiler, which is Mozilla’s SDK for accessing the profiler. Unfortunately this SDK is not well documented nor is it very intuitive to use, so I wrapped it with our own ko/profiler SDK.
The steps to actually profile some code were fairly simple, and boil down to the following:
// Start Profiler
var profiler = require("ko/profiler");
profiler.enable();
profiler.start();// Perform action that we want to profile
ko.open.URI('file:///home/nathan/Projects/komodo-dev/Construct');
// Save profiler result and end it
setTimeout(function() {
require("ko/profiler").save();
profiler.stop();
}, 2000);
Ending the profiler is on a timeout because the code in question might fire some additional events, as it does in this case. Of course timeouts are a big red flag in production code, but for testing/profiling it is completely fine.
The code you see above would allow me to easily profile Komodo file opening, and see how my changes affected the bottom line.
When I ran this code I could run down the chain of commands and find out what command in particular was causing a slowdown. In this case I found that the call `applyColorScheme()` in scintilla.xml (a XUL binding) was running unreasonably slow.
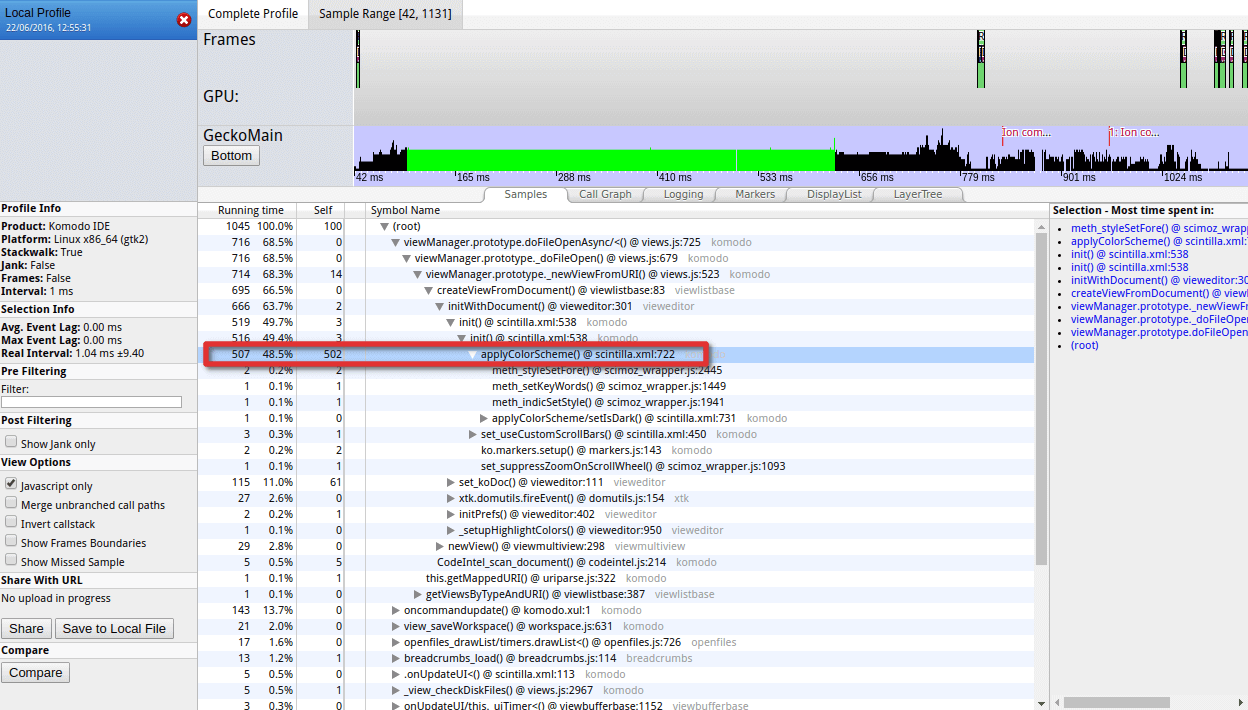
Upon inspection of that code I found that the code that was running slow was in Python. So now let’s have a look at profiling Python.
Profiling Python
Profiling Python is a little bit more interesting, mainly because now I get to use Komodo itself. For this I used cProfile, a python library built for this exact purpose. Using it is simple and straightforward:
import cProfile
pr = cProfile.Profile()
pr.enable()
# MY CODE
pr.disable()
pr.dump_stats('/tmp/profiledump')
This would sample anything between enable() and disable(). Using this code I narrowed down the issue that was causing `applyColorScheme()` to be far slower than it needed to be.
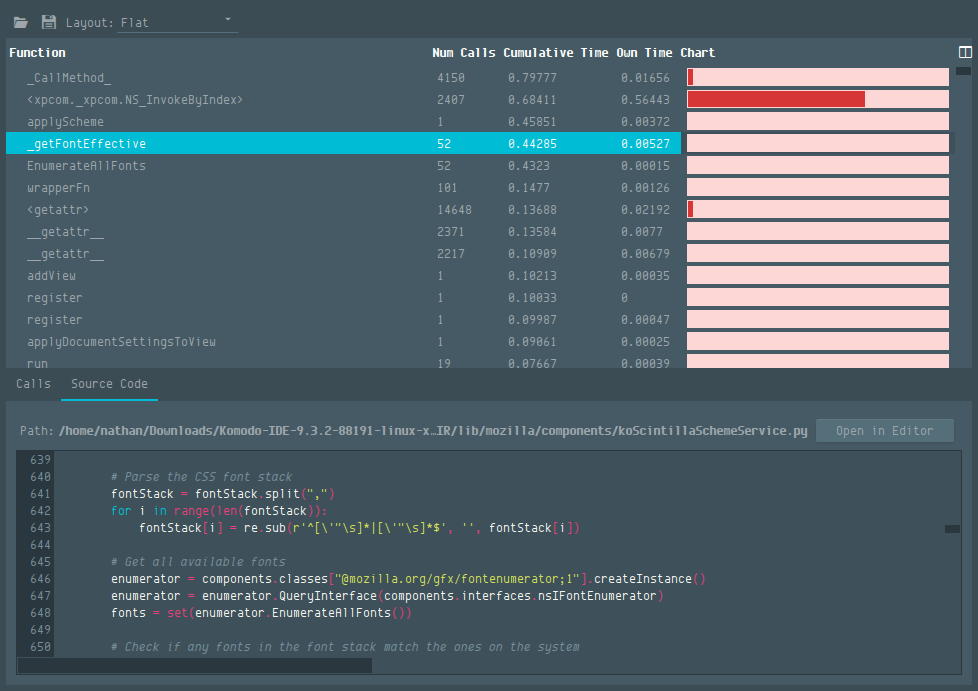
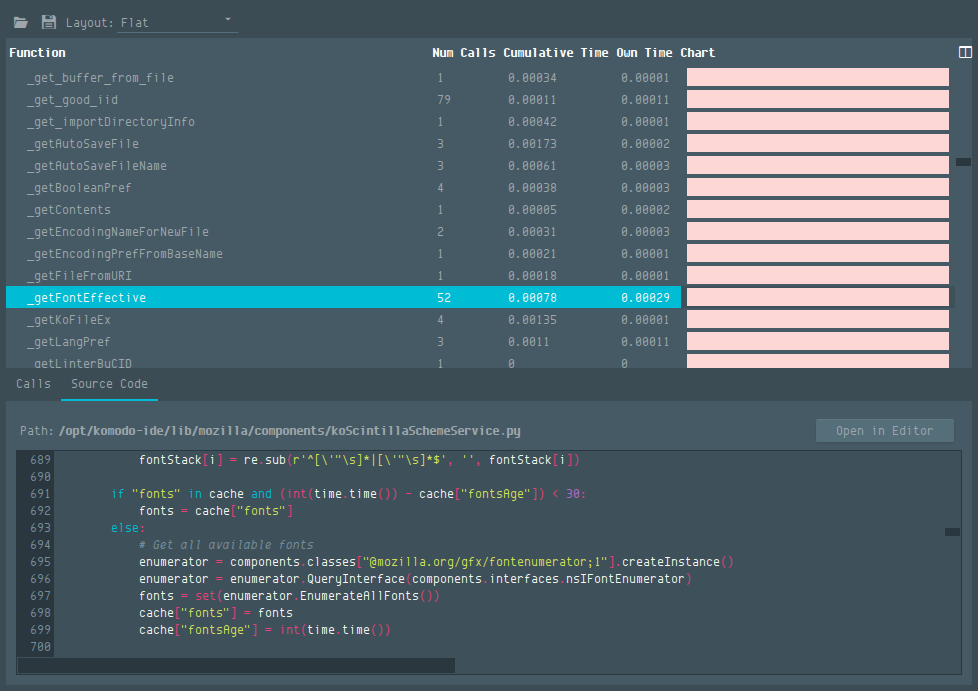
I found that Komodo was polling available system fonts for every buffer that was opened / had a color scheme applied. Polling system fonts is sadly a slow process, but a simple fix was to simply cache the results and voila – file opening and color scheme switching is now as snappy as can be.
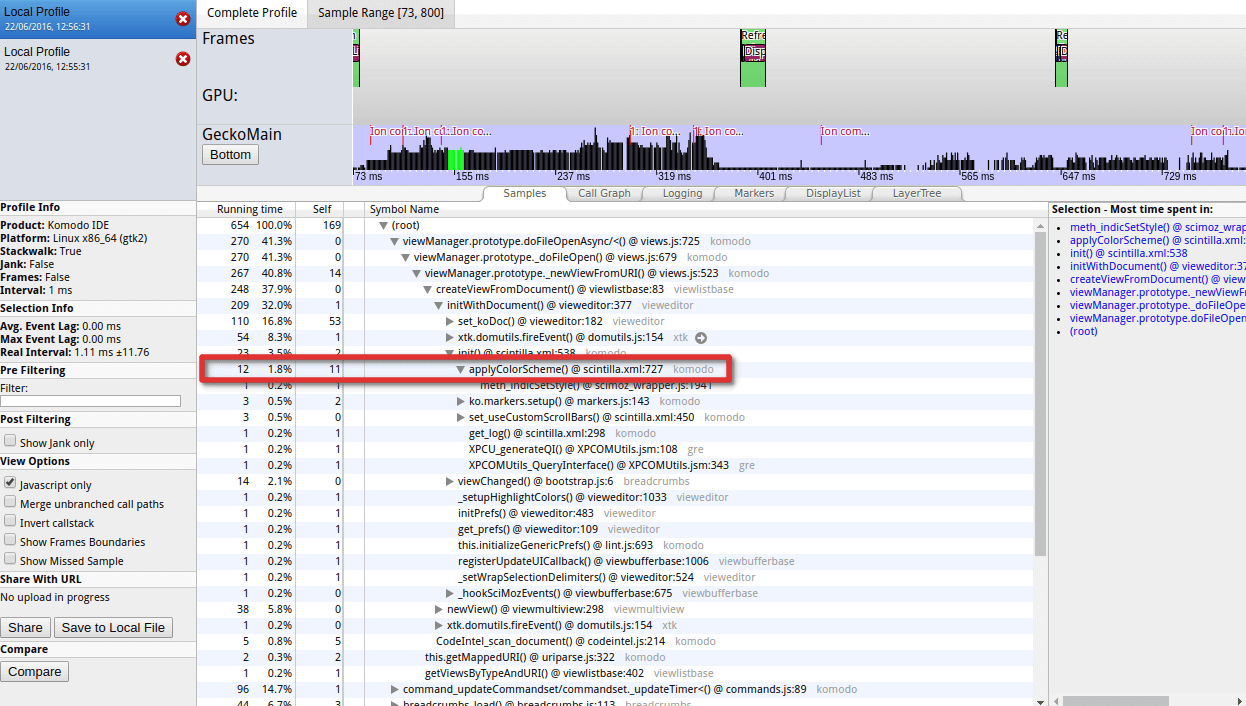
And running the profiler again in JS also reflected the improved file opening performance:
Fixing a Long Standing Memory Leak
Those of you who have used Komodo for a number of years have probably noticed that Komodo starts to use more and more memory the longer you have it running. Unfortunately, there was a memory leak, though it wasn’t a very serious one. The leak increased Komodo’s memory usage slightly each time you opened a file and it’s impact was really only felt if you opened many files or used Komodo for a long time. Many developers got into the habit of restarting Komodo once per day. Unfortunately as simple as it was to reproduce this bug, it wasn’t nearly as simple to find its cause.
To find the cause I started by looking at different tools we could use to profile memory usage. Python has various tools available to it for this task, but unfortunately because of PyXPCOM being extremely complex many of these tools didn’t make the cut as they quite simply failed to analyze our Python code, leading to exceptions of various kinds. After much digging I finally landed on Meliae, which luckily was able to inspect Komodo’s Python code just fine. However being able to inspect our running code is just one thing, the other thing is being able to analyze it. For this I landed on a tool called RunSnakeRun, which has a component called “runsnakemem” that is used for analyzing memory usage.
Having my tools in place I fired up Komodo, started the memory profiler, opened a bunch of files and then closed them, then finished the profiler and parsed it into “runsnakemem”. The results were very telling:
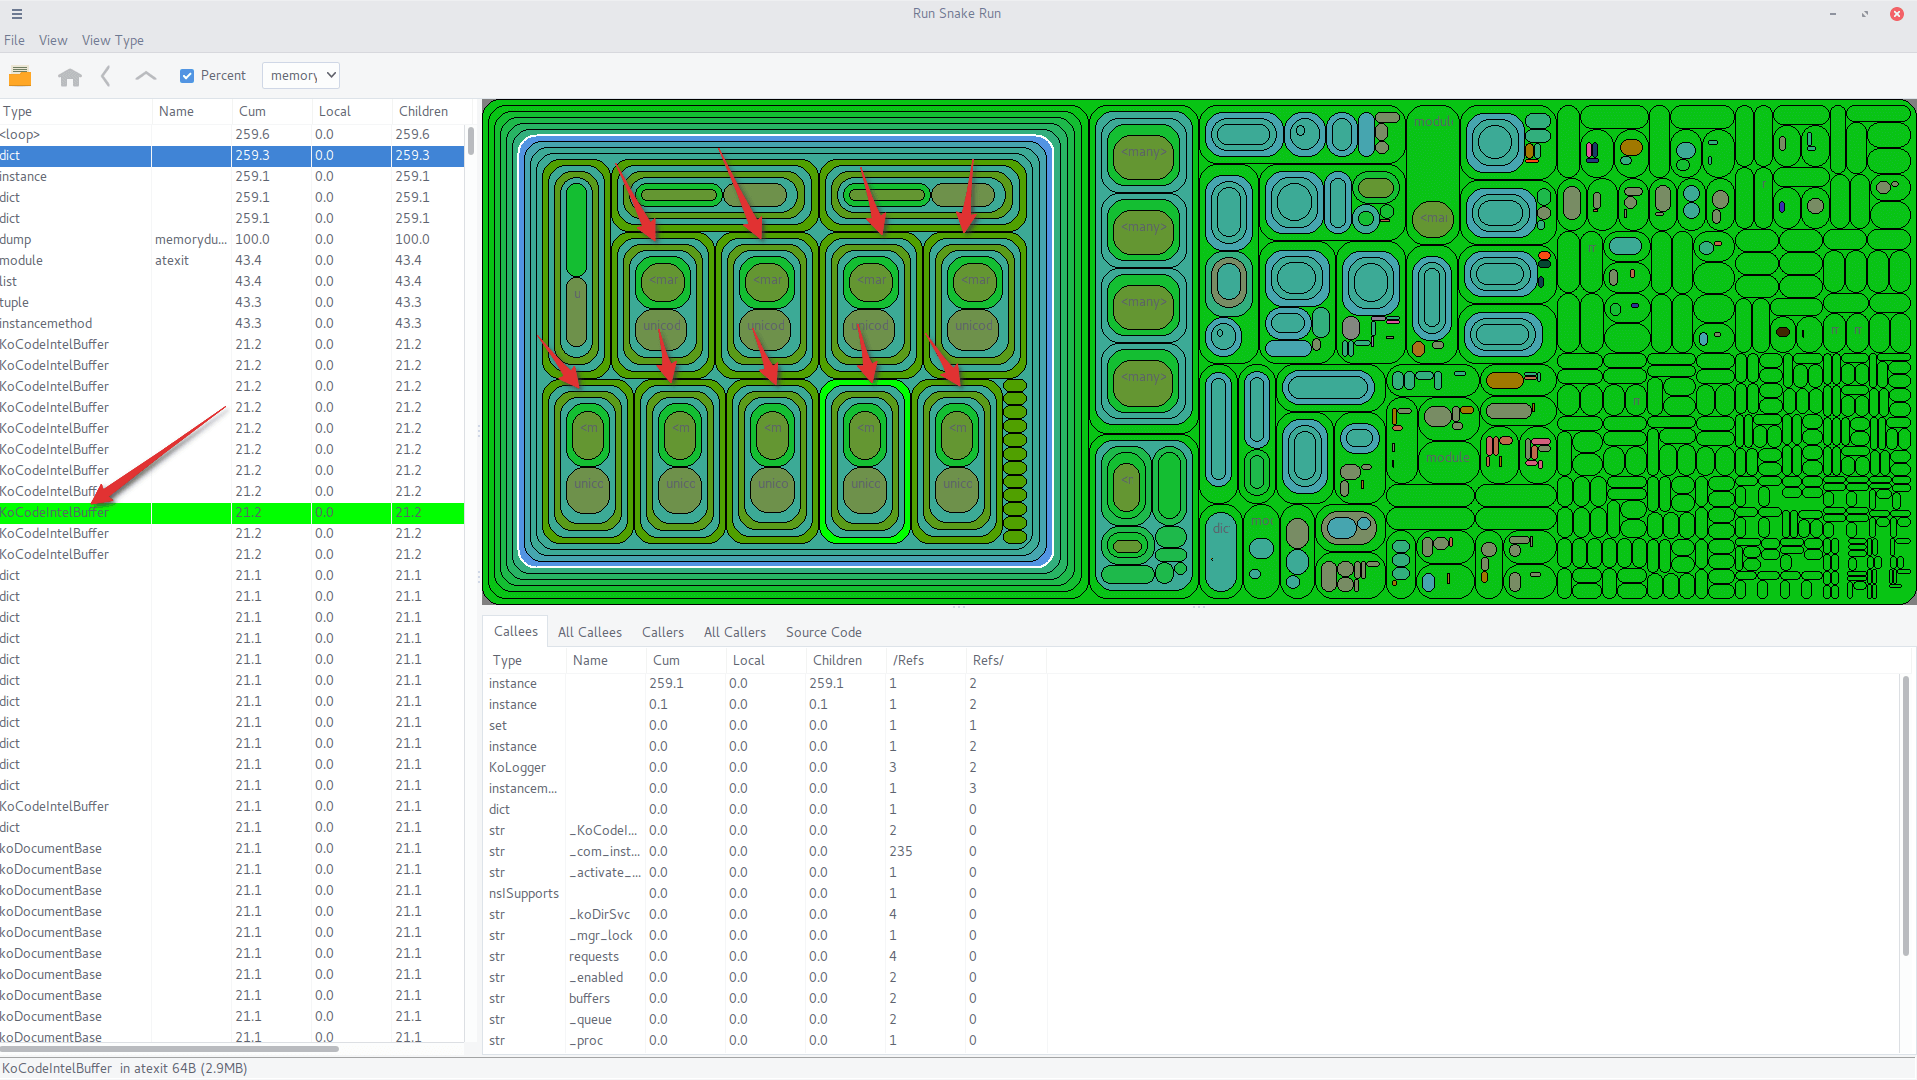
Why was Komodo holding on to codeintel buffers for file buffers that were no longer open? It could be a cache, but given the size of them that would have been overkill. Most likely this was our memory leak. However, while it gave me more context it still didn’t give me the cause of the leak. Unfortunately, there was no simple tool that could point me to the exact location. All I could do was use all the variables at my disposal to narrow down the exact cause of the leak. After much digging I finally narrowed it down to this line. Komodo is adding the codeintel buffer to memory, but after searching around for a bit I could not find any reference whatsoever to it being removed again. It seems it was holding on to them for caching purposes, but a proper cache needs to clean itself every once in a while, which just wasn’t happening.
The fix was simple, the code in question already had all the logic in place to rebuild the cache if the entry didn’t exist. And the performance gains from the cache itself were very negligible. So I simply hooked it up to remove the cached entry whenever the file was closed. After this I fired up my Komodo build and opened a couple dozen files and closed them again, all the while observing Komodo’s memory usage. I was happy to observe that this indeed solved the memory leak.
I’ve been using Komodo X for months now and am happy to report that the memory leak has not resurfaced and I can keep Komodo running for as long as I like.
The Never Ending Battle
Fixing bugs, improving performance, enhancing UX .. these things are never ending in software development. We have made significant improvements in Komodo X, and received a ton of positive feedback on how snappy Komodo X feels. But we’re never done, we will continue to focus our efforts on these areas for future releases. We are dedicated not just to releasing new awesome features, but also to keeping Komodo stable, snappy and easy to use.
Title photo courtesy of Isaac Jenks on Unsplash.


