Working with data is hard. Raw data usually presents several challenges that need to be solved before you can actually work with it productively. Sometimes you don’t have enough data or the data has gaps that need to be filled. In many cases, obtaining the data is expensive or difficult due to external conditions. In addition, privacy regulations affect the ways in which you can use or distribute a dataset. For all of these reasons, making use of synthetic data is a good alternative, since it can fulfill the same needs with little effort.
In this article, we will introduce you to ten Python libraries that enable you to produce synthetic data for specific business contexts. But first we need to answer the obvious question:
What Is Synthetic Data?
According to the definition set forth by the UK’s Office for National Statistics (ONS):
“Synthetic data are microdata records created to improve data utility while preventing disclosure of confidential respondent information. Synthetic data is created by statistically modelling original data, and then using those models to generate new data values that reproduce the original data’s statistical properties. Users are unable to identify the information of the entities that provided the original data.”
Thus, synthetic data has three important characteristics:
- Synthetic data is created from a statistical model.
- The statistical properties of synthetic data should be similar to those of the original data.
- Synthetic data must be anonymized.
The ONS methodology also provides a scale for evaluating the maturity of a synthetic dataset. This scale considers how closely the synthetic data resembles the original data, its purpose, and the disclosure risk. The methodology includes:
- Synthetic structural: preserves the structure of the original data, which is useful for testing code.
- Synthetic valid: not only preserves the structure, but also returns values that are plausible in the context of the dataset. You should introduce missing value codes, errors, and inconsistencies to replicate the original data.
- Synthetically-augmented plausible: replicates the distributions of each data sample where possible without accounting for the relationship between different columns (univariate).
- Synthetically-augmented multivariate plausible: replicates high-level relationships with plausible distributions (multivariate).
- Synthetically-augmented multivariate detailed: replicates detailed relationships. For this one, you must perform disclosure control evaluation on a case-by-case basis.
- Synthetically-augmented replica: provides the closest possible replication. Performing disclosure control evaluation on a case-by-case basis is critical.
Each of the following libraries take different approaches to generating synthetic data. Some focus on providing only the synthetic data itself, but others provide a full set of tools that aim to achieve the synthetically-augmented replica described above.
Before You Start: Install The Synthetic Data Environment
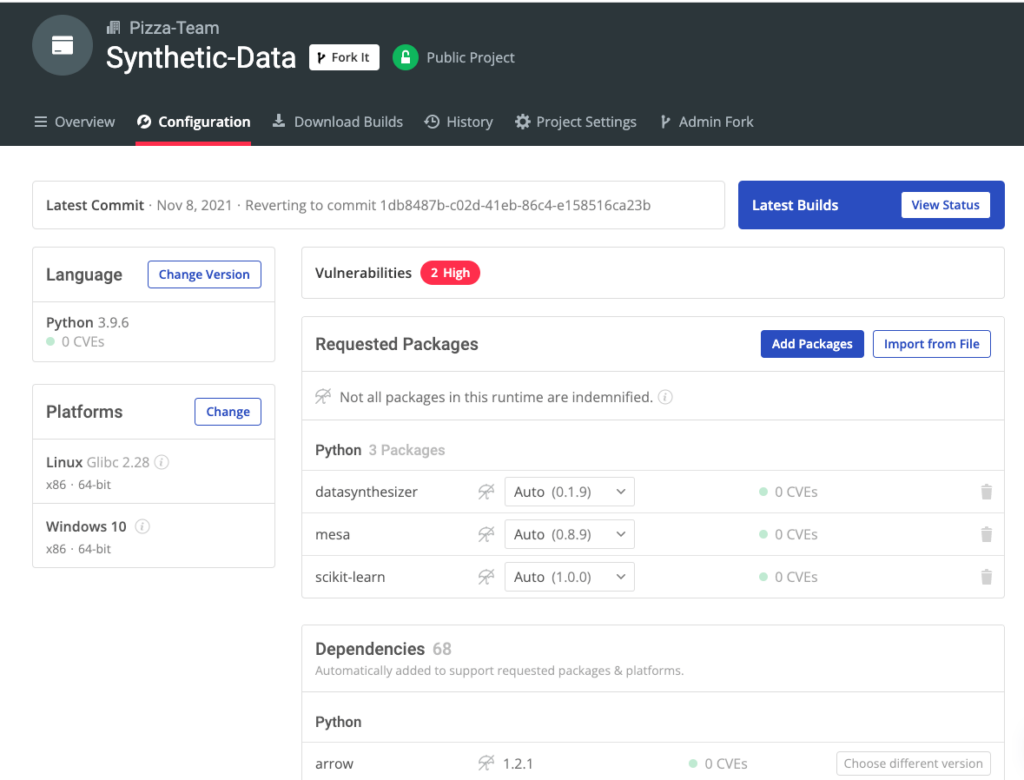
To try out some of the packages in this article, you can download and install our pre-built Synthetic Data environment, which contains a version of Python 3.9 and the packages used in this post, along with all their dependencies.
In order to download this ready-to-use Python environment, you will need to create an ActiveState Platform account. Just use your GitHub credentials or your email address to register. Signing up is easy and it unlocks the ActiveState Platform’s many benefits for you!
Or you could also use our State tool to install this runtime environment.
For Windows users, run the following at a CMD prompt to automatically download and install our CLI, the State Tool along with the Synthetic Data runtime into a virtual environment:
powershell -Command "& $([scriptblock]::Create((New-Object Net.WebClient).DownloadString('https://platform.www.activestate.com/dl/cli/install.ps1'))) -activate-default Pizza-Team/Synthetic-Data"
For Linux users, run the following to automatically download and install our CLI, the State Tool along with the Synthetic Data runtime into a virtual environment:
sh <(curl -q https://platform.www.activestate.com/dl/cli/install.sh) --activate-default Pizza-Team/Synthetic-Data
1–DataSynthesizer
DataSynthesizer is a tool that provides three modules (DataDescriber, DataGenerator, and ModelInspector) for generating synthetic data. It also has a GUI (a Web app based on Django) that enables you to test it directly without coding. In addition, it has three different ways to generate data: random, independent, or correlated.
For example, the code below generates and evaluates a correlated synthetic dataset taken from the Titanic Dataset CSV file:
from DataSynthesizer.DataDescriber import DataDescriber
from DataSynthesizer.DataGenerator import DataGenerator
from DataSynthesizer.ModelInspector import ModelInspector
from DataSynthesizer.lib.utils import read_json_file, display_bayesian_network
# input dataset
input_data = './data/titanic.csv'
# location of two output files
mode = 'correlated_attribute_mode'
description_file = f'./out/description.json'
synthetic_data = f'./out/sythetic_data.csv'
categorical_attributes = {'Name': True, 'Sex':True, 'Ticket':True, 'Cabin': True, 'Embarked': True}
candidate_keys = {'PassengerId': True}
# An attribute is categorical if its domain size is less than this threshold.
threshold_value = 20
# A parameter in Differential Privacy. It roughly means that removing a row in the input dataset will not
# change the probability of getting the same output more than a multiplicative difference of exp(epsilon).
# Increase epsilon value to reduce the injected noises. Set epsilon=0 to turn off differential privacy.
epsilon = 1
# The maximum number of parents in Bayesian network, i.e., the maximum number of incoming edges.
degree_of_bayesian_network = 2
# Number of tuples generated in synthetic dataset.
num_tuples_to_generate = 1000
describer = DataDescriber(category_threshold=threshold_value)
describer.describe_dataset_in_correlated_attribute_mode(dataset_file=input_data, epsilon=epsilon, k=degree_of_bayesian_network, attribute_to_is_categorical=categorical_attributes,    attribute_to_is_candidate_key=candidate_keys)
describer.save_dataset_description_to_file(description_file)
display_bayesian_network(describer.bayesian_network)
generator = DataGenerator()
generator.generate_dataset_in_correlated_attribute_mode(num_tuples_to_generate, description_file)
generator.save_synthetic_data(synthetic_data)
# Read both datasets using Pandas.
synthetic_df = pd.read_csv(synthetic_data)
# Read attribute description from the dataset description file.
attribute_description = read_json_file(description_file)['attribute_description']
inspector = ModelInspector(titanic_df, synthetic_df, attribute_description)
inspector.mutual_information_heatmap()
As you can see, the code is fairly simple:
- Set input parameters and the control level for the Bayesian network build as part of the data generation model.
- Instantiate the data descriptor, generate a JSON file with the actual description of the source dataset, and generate a synthetic dataset based on the description.
- Check the distribution of values generated against the original dataset with the inspector.
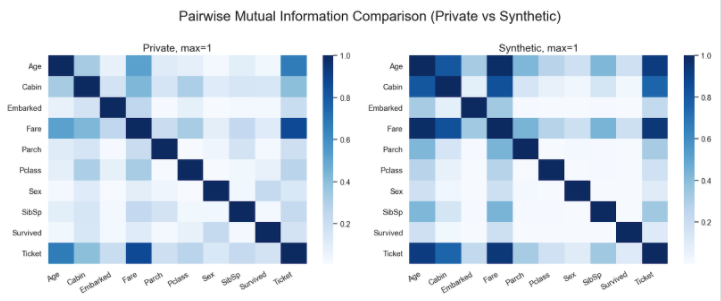
The following image shows the correlation matrix of the original dataset versus the one that we generated:
2–Pydbgen
Sometimes you need a simpler approach. For instance, maybe you just need to generate a few common variables with some degree of customization. In this case, you can use Pydbgen, which is a tool that enables you to generate several different types of data, including:
- Name, country, city, real (US) cities, US state, zip code, latitude, and longitude;
- Month, weekday, year, time, and date;
- Personal email, official email, and SSN;
- Company, job title, phone number, and license plate.
It can output data in multiple formats, including:
- Pandas Series
- DataFrames
- sqlite3 databases
- Excel files
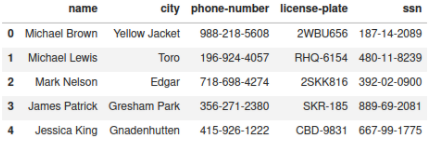
You can create a simple DataFrame using the code below:
import pydbgen
from pydbgen import pydbgen
src_db = pydbgen.pydb()
pydb_df = src_db.gen_dataframe(1000, fields=['name','city','phone','license_plate','ssn'], phone_simple=True)
pydb_df.head()
Note that you must have version 2.0.4 (or higher) of the Faker package dependency in order for the code to work.
3–Mimesis
Mimesis is similar to Pydbgen, but offers a more complete solution. Mimesis supports a diverse range of data providers and includes methods for generating context-aware columns. In addition, it offers thirty-four language localizations with a high degree of specialization (i.e. you can generate valid Brazilian social security numbers or Romanian addresses), which makes it perfect for creating valid, heterogeneous synthetic datasets.
For example, you can create a sample DataFrame with HTTP content-types, emojis, and valid RNA and DNA sequences with the following code:
from mimesis.schema import Field, Schema
from mimesis import Internet, Science
_ = Field()
description = (
	   lambda: {
	       'name': _('text.word'),
       'timestamp': _('timestamp', posix=False),
       'request': {
	           'content_type': _('content_type'),
           'emoji': _('emoji'),
           'http_status_code': _('http_status_code'),
           'param1': _('dna_sequence'),
           'param2': _('rna_sequence')
       },
   }
)
schema = Schema(schema=description)
res_df = pd.DataFrame( schema.create(iterations=1000) )
req_df = pd.json_normalize( res_df['request'] )
pd.concat( [res_df, req_df], axis=1 ).drop('request', axis=1).head()
4–Synthetic Data Vault
The Synthetic Data Vault (SDV) package is an environment rather than a library. It offers several methods for generating synthetic data using multivariate cumulative distribution functions or Generative Adversarial Networks. In addition, it provides a validation framework and a benchmark for synthetic datasets, as well as the ability to generate time series data and datasets with one or more tables.
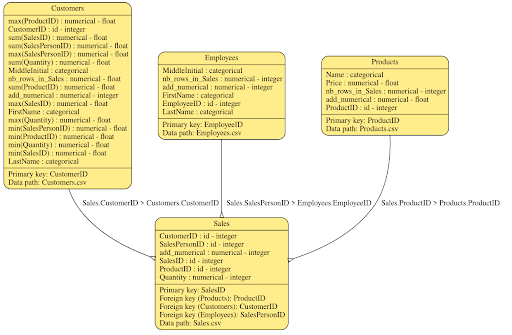
For instance, this code loads a relational database structure along with some sample rows and an Entity Relationship (ER) diagram:
from sdv import load_demo
metadata, tables = load_demo('SalesDB_v1',metadata=True)
metadata.visualize()
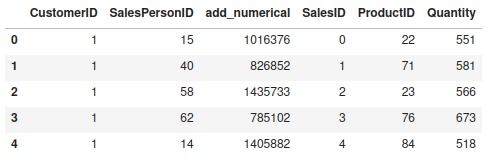
The seed data is stored in the tables’ dictionaries, and each table has a Pandas DataFrame with sample rows. A customer-oriented DataFrame might look like this:
You can create your own relational definitions using a simple JSON file that defines the tables and the relationships between them. Once you have the metadata and samples, you can use the HMA1 class to fit a model in order to generate synthetic data that complies with the defined relational model:
from sdv.relational import HMA1
model = HMA1(metadata)
model.fit( tables )
samples = model.sample(num_rows = 100 )
samples['Sales'].head()
5–Plaitpy
Plaitpy takes an interesting approach to generate complex synthetic data. First, you define the structure and properties of the target dataset in a YAML file, which allows you to compose the structure and define custom lambda functions for specific data types (even if they have external Python dependencies).
For example, the following definition composes a uniform timestamp template and a dependent sample value:
import plaitpy
fig, ax = plt.subplots(figsize=(12,3))
t = plaitpy.Template("./data/stocks.yml")
data = t.gen_records(100)
timeseries_df = pd.concat([pd.DataFrame(d, index=[1]) for d in data]).reset_index().drop('index', axis=1).sort_values(by='timestamp')
timeseries_df
ax.plot( timeseries_df['timestamp'], timeseries_df['val1'], label='val 1')
ax.plot( timeseries_df['timestamp'], timeseries_df['val2'], label='val 2')
ax.plot( timeseries_df['timestamp'], timeseries_df['val3'], label='val 3')
ax.legend()
plt.show()
Plaitpy’s template system is very flexible. For instance, when we define timestamp values from the “human daily pattern,” you can see its power:
define:
 seconds_in_day: 60 * 60 * 24
 seconds_in_week: ${seconds_in_day} * 7
 time_offset: ${seconds_in_week}
 weekdays: 5 / 7.0
 weekends: 2 / 7.0
 weekends_weight: 1.5 # 1.0 = weighted same as weekday
mixin:
 - timestamp/human_daily_pattern.yaml
fields:
 # day of week is a proportional mixture of weekends and weeknights
 # we can change the values to elevate or damp weekend activity here
 _dayofweek:
   mixture:
     - random: randint(1, 2)
       weight: ${weekends} * ${weekends_weight}
     - random: randint(3, 7)
       weight: ${weekdays}
   finalize: value * ${seconds_in_day}
 time:
   lambda: this._basetime + this._hourofday + this._dayofweek
6–TimeseriesGenerator
Nike’s Timeseries-Generator package is an interesting and excellent way to generate time series data. In this case, a generator is a linear function with several factors and a noise function. The library includes several different generators and two types of noise functions.
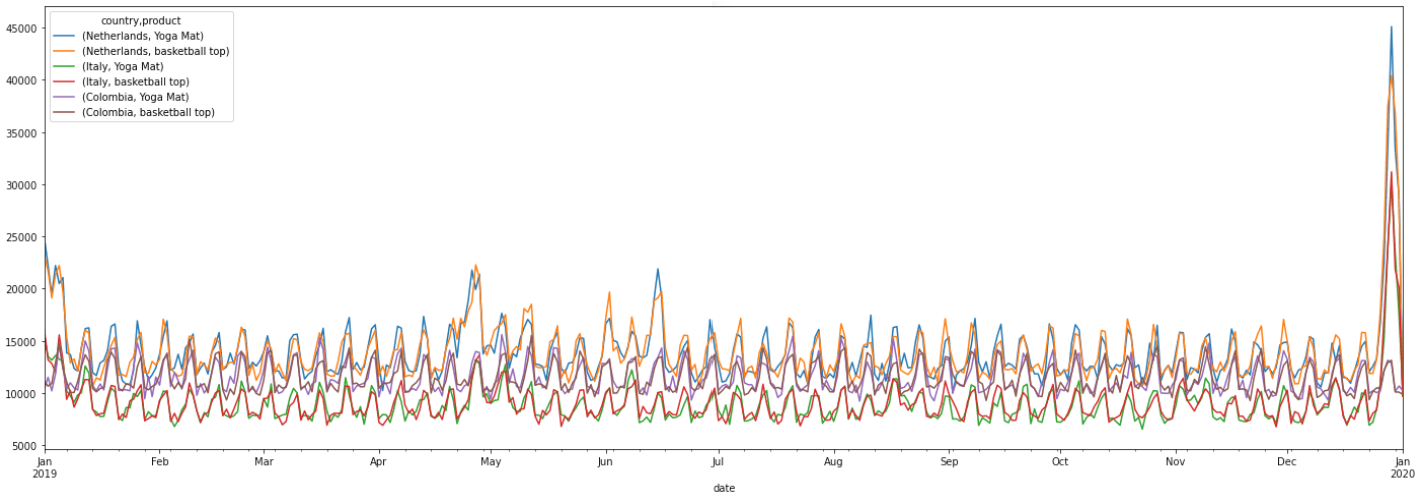
Below, you can see how to generate time series data for the sale of two products over the span of a year. Notice the specific weights for Friday, Saturday, and Sunday in the WeekdayFactor, as well as the weight for Christmas Day in the HolidayFactor:
from pandas._libs.tslibs.timestamps import Timestamp
from timeseries_generator import LinearTrend, Generator, WhiteNoise, RandomFeatureFactor
from timeseries_generator.external_factors import CountryGdpFactor, EUIndustryProductFactor
from timeseries_generator import Generator, HolidayFactor, RandomFeatureFactor, WeekdayFactor, WhiteNoise
start_date = Timestamp("01-01-2019")
end_date = Timestamp("01-01-2020")
features_dict = {"country": ["Netherlands", "Italy", "Colombia"],
               "product": ["Yoga Mat", "basketball top"]}
g: Generator = Generator(
	   factors={
	       CountryGdpFactor(),
       EUIndustryProductFactor(),
       HolidayFactor(holiday_factor=2.,special_holiday_factors={"Christmas Day": 10.}),
       WeekdayFactor(col_name="weekend_boost_factor", factor_values={4: 1.15, 5: 1.3, 6: 1.3} ),
       WhiteNoise()
   },
   features=features_dict,
   date_range=pd.date_range(start=start_date, end=end_date),
   base_value=10000
)

 df = g.generate()
 plot_df = df.set_index('date')
plot_df[['country', 'value', 'product']].pivot(columns=['country', 'product'], values='value').plot(figsize=(24,8))
7–Gretel Synthetics
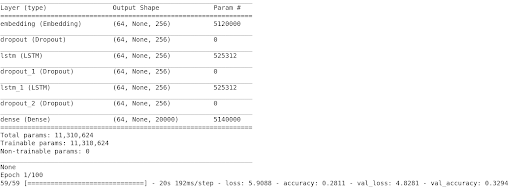
Recurrent Neural Networks (RNN) is an algorithm suitable for pattern recognition problems. Gretel Synthetics uses this approach to produce synthetic datasets for structured and unstructured texts.
Below, you can see an example (extracted from the package documentation) in which the network is trained to learn from a structured dataset (about scooter rides) that contains two pairs of coordinates:
from pathlib import Path
from gretel_synthetics.train import train_rnn
from gretel_synthetics.config import LocalConfig
from gretel_synthetics.generate import generate_text
# Create a config that we can use for both training and generating data
# The default values for “max_lines“ and “epochs“ are optimized for training on a GPU.
config = LocalConfig(
max_line_len=2048, # the max line length for input training data
vocab_size=20000, # tokenizer model vocabulary size
field_delimiter=”,”, # specify if the training text is structured, else “None“
overwrite=True, # overwrite previously trained model checkpoints
checkpoint_dir=(Path.cwd() / ‘checkpoints’).as_posix(),
input_data_path=”https://gretel-public-website.s3-us-west-2.amazonaws.com/datasets/uber_scooter_rides_1day.csv” # filepath or S3
)
train_rnn(config)
Interestingly, you can define a callback function to validate the results of the generated text. Here, it checks that there are six columns in each line:
def validate_record(line):
   rec = line.split(", ")
   if len(rec) == 6:
       float(rec[5])
       float(rec[4])
       float(rec[3])
       float(rec[2])
       int(rec[0])
   else:
       raise Exception('record not 6 parts')

 for line in generate_text(config, line_validator=validate_record, num_lines=10):
   print(line)
The start and end points that it returns contain some possible routes, but as you can see, some of the routes generated from the synthetic coordinates are odd due to a lack of context:
8–Scikit-Learn
Scikit-learn is like a Swiss Army knife for machine learning in Python. It provides implementations of almost all well-known algorithms, and it’s usually the first stop for anyone who wants to learn data science in a practical way. But it also contains a package that enables you to generate synthetic structural data suitable for evaluating algorithms in regression as well as classification tasks.
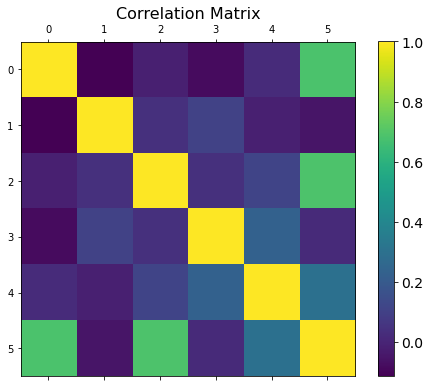
The following code generates a random regression dataset and plots its correlation matrix (notice that you can define the number of relevant features and the level of noise, among other parameters):
from sklearn import datasets
fig = plt.figure(figsize=(8, 6))
X, y = datasets.make_regression(n_samples=150, n_features=5,n_informative=3, noise=0.2)
reg_df = pd.DataFrame(X, columns=['Ft %i' % i for i in range(5)])
reg_df['y'] = y
plt.matshow( reg_df.corr(), fignum=fig.number )
cb = plt.colorbar()
cb.ax.tick_params(labelsize=14)
plt.title('Correlation Matrix', fontsize=16);
Scikit-learn enables you to generate random clusters, regressions, signals, and a large number of synthetic datasets. Make sure you choose the right one for your task!
9–Mesa
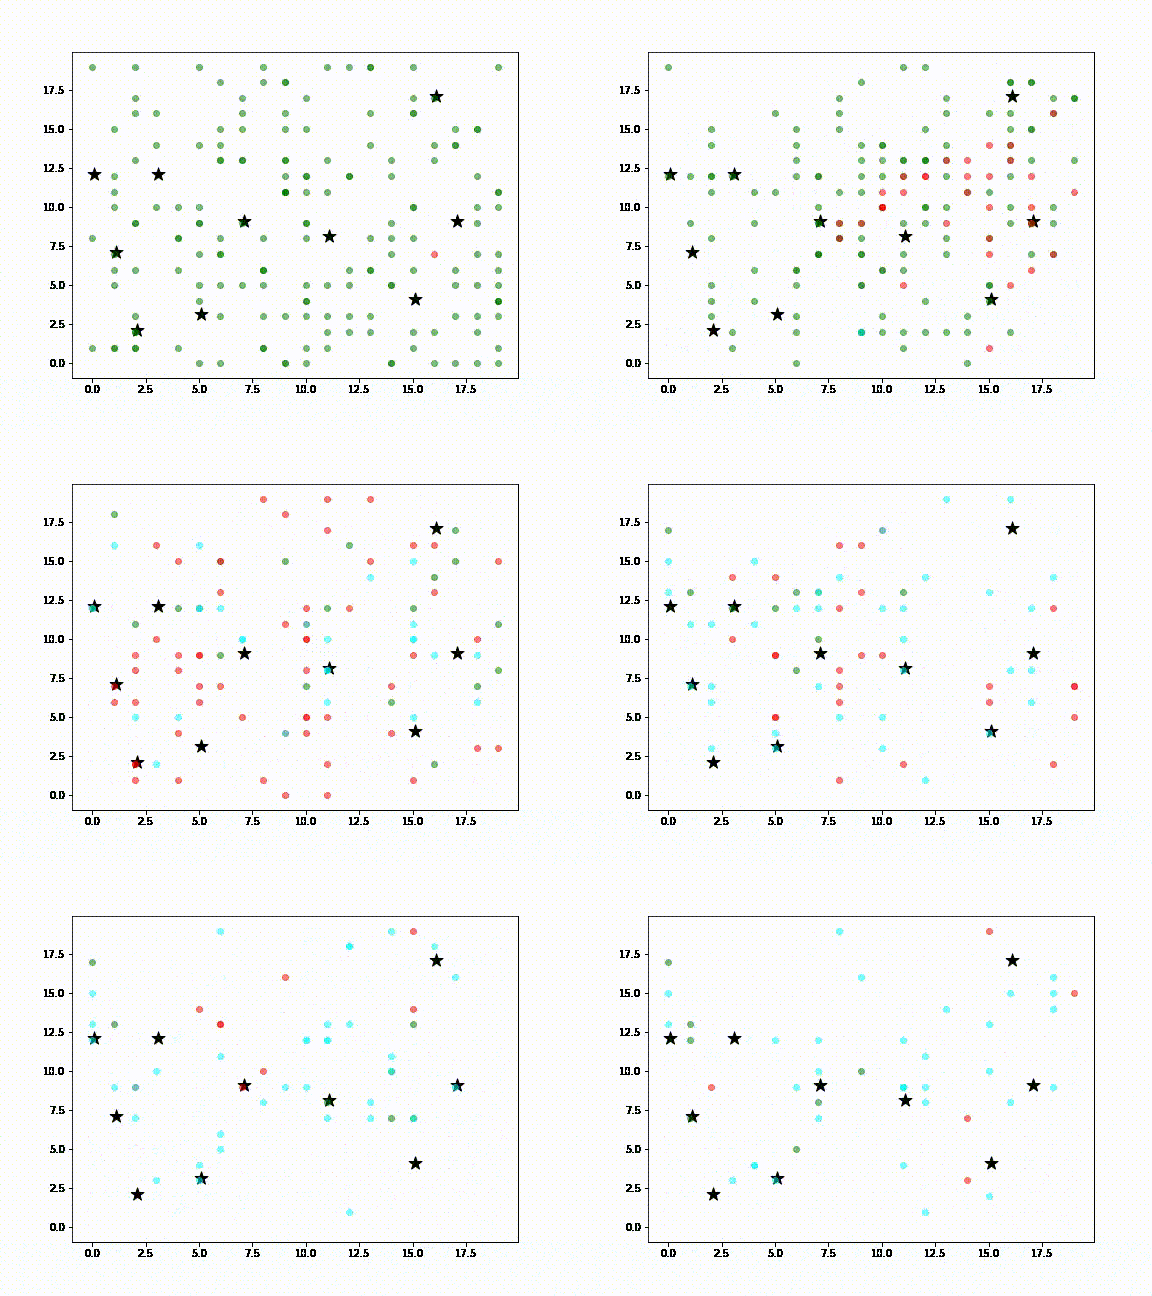
If you want to create synthetic data from complex scenarios, you’ll want to consider agent-based modeling (ABM), which provides an artificial environment in which agents can interact with one another and their environment. Each agent includes some micro-behaviors that can lead to the emergence of unexpected tendencies. ABM is especially useful for situations in which it is difficult to collect data, such as social interactions. This package also provides tools for collecting large amounts of data based on slightly different setup scenarios in Pandas Dataframes.
To learn more, you can check out this simple model of the spread of COVID-19:
10-Zpy
One of the most difficult parts of image processing with machine learning is finding an interesting dataset. To be sure, there are many datasets out there, but obtaining one for a specific business use case is quite a challenge. Fortunately, Zumolabs created Zpy, which allows you to harness the power of Python and Blender (an open source 3D graphics toolset) to create datasets of rendered simulations. Zpy can reduce both the cost and the effort that it takes to produce realistic image datasets that are suitable for business use cases.
Below, you can see the results of a simulated retail shelf:
Image from Zumolabs.ai
Conclusions – Generate Synthetic Data for Your Use Case
Data is an expensive asset. Many companies dream of having a large volume of clean, well-structured data, but that takes a lot of money and sweat, and it comes with a lot of responsibility. Fortunately, synthetic data can be a great way for companies with fewer resources to get faster, cost-effective results while generating a solid testbed.
In this article, we introduced a variety of Python packages that can help you generate useful data even if you only have a vague idea of what you need. It’s important to choose the right tool for the kind of data you need:
- Want to generate more data from your limited dataset?
- Try DataSynthesizer.
- Want to generate contact or date information?
- Try pydbgen or Mimesis.
- Need relational data?
- Try Synthetic Data Vault (SDV).
- No sample data, but know what you want?
- Try plaitpy.
- Need time series data?
- Try TimeSeriesGenerator or SDV.
- Want an AI to generate data for you?
- Try Gretel Synthetics or Scikit-learn.
- Want agent-based modelling to generate data for complex scenarios?
- Try Mesa.
- Need to generate image data?
- Try Zpy.
Next Steps:
- You can find all of the code that we used in this article on GitHub.
- Download the Synthetic Data environment and try out some of the tools mentioned in this article.
With the ActiveState Platform, you can create your Python environment in minutes, just like the one we built for this project. Try it out for yourself or learn more about how it helps Python developers be more productive.
Recommended Reads
Automating Data Preparation with Modern Tooling like Snorkel and OpenRefine


