Stackoverflow annually surveys its users, who are overwhelmingly technically literate, and typically either a professional or hobby developer — the kinds of people that are likely to be opinionated when it comes to AI.
But do most developers believe AI will change the world for the better or for the worse?
This blog post will examine the latest version of Stackoverflow’s Developer Survey dataset to see who the respondents were, and which kinds of respondents are more likely to be optimistic or pessimistic about AI.
In this tutorial, you will get to:
- Install Python
- Import the survey dataset
- Create a Dataframe with just the data we want to examine
- Explore and clean up the data
- Use panda’s GroupBy function to group respondents so we can compare results
- Plot the data so we can visualize the results
Data Analysis Step 1 — Install Python
To follow along with the code in this tutorial, you’ll need to have a recent version of Python installed, along with all the packages used in this post. The quickest way to get up and running is to install the Pandas Tutorial Python environment for Windows or Linux, which contains a version of Python with Pandas, the package you need to follow along with this tutorial.
- Pandas will be used to import, clean group, and plot the data
In order to download the ready-to-use builds you will need to create an ActiveState Platform account. Just use your GitHub credentials or your email address to register. Signing up is easy! And it unlocks the ActiveState Platform’s many benefits for you.
For Windows users, run the following at a CMD prompt to automatically download and install our CLI, the State Tool along with the Pandas Tutorial runtime into a virtual environment:
powershell -Command "& $([scriptblock]::Create((New-Object Net.WebClient).DownloadString('https://platform.www.activestate.com/dl/cli/install.ps1'))) -activate-default Pizza-Team/Pandas-Tutorial"
For Linux or Mac users, run the following to automatically download and install our CLI, the State Tool along with the Pandas Tutorial runtime into a virtual environment:
sh <(curl -q https://platform.www.activestate.com/dl/cli/install.sh) --activate-default Pizza-Team/Pandas-Tutorial
2 — Importing Data with Pandas
First, we’ll download the Stackoverflow survey dataset from Kaggle (account required). Thankfully, it’s well structured into two distinct CSVs: “survey_results_public.csv” and “survey_results_schema.csv”.
We’ll start with importing Pandas, and then read in the CSVs:
import pandas as pd
SO_survey = pd.read_csv('survey_results_public.csv', low_memory=False)
SO_schema = pd.read_csv('survey_results_schema.csv')
Note that we set the option low_memory=False because the dataset for the survey results is quite big, and will require more memory.
Now let’s check the schema by printing it, which will hopefully give us a good idea about the columns of the dataset, as well as the structure.
From the schema we can see that each column corresponds to a survey question (or to be more precise, a value indicative of the question). Moreover, each row contains an answer to the questions. We have 128 answers as there are 128 rows plus a header row in this schema, for a total of 129 rows. Let’s take a look at the structure of the survey now.
We can use SO_survey.shape to learn more about the number of respondents and rows of the data set, which will be (98855, 129) in this case. As we can see, there are more than 98000 people who answered this survey. Let’s quickly analyze our dataframe as the next step to get an overall feeling for it. Using SO_survey.columns returns us the following list:
2 — Creating a Dataframe with Pandas
To make it easier to work with our dataset, we can get rid of the columns that we won’t be using. This can be done by using the drop function, or else indexing the main Dataframe with a list of column names. In this case, we’ll use the latter option, because the amount of columns we’ll be getting rid of far more columns than we’ll work with.
SO_smaller = SO_survey[to_get]
In the code snippet above, to_get is the list of column names we’ll be working with.
3 — Data Exploration with Pandas
Another important step while working on data is to check how many “Not a Number” (NaN) values we have. For this, we can use the following code snippet:
nulls = SO_smaller.isnull().sum() / len(SO_smaller) * 100print("Percentual of Null Values: ")
print(nulls.sort_values(ascending=False))
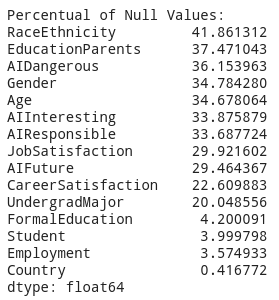
Which will print the following results, showing we have quite a lot of missing values:
Another function that will help us understand the data is the describe() function, which provides basic statistics:
SO_smaller.describe()
4 — Using GroupBy in Pandas
Now that we have some idea of what we’re working with, we can use the groupby function of pandas to check the general consensus towards AI by gender. First, we groupby the gender column:
grouped = SO_smaller.groupby('Gender')
Then we can use the value_counts() function to better understand the results for female versus male groups.
a = grouped.get_group("Male")
a['AIFuture'].value_counts()
b = grouped.get_group("Female")
b['AIFuture'].value_counts()
Which returns the following results:
As we can see, only 18% of male respondents are worried about AI, whereas a statistically significant 25% of female respondents are worried. Men definitely have a bias toward AI versus women.
Now let’s look at whether education is more significant of a factor than gender. For example, we might want to compare the general consensus of natural science/engineering graduates versus social science graduates. First, we can get an idea of the undergrad major for all of the respondents with the following code snippet:
total = SO_smaller["UndergradMajor"].value_counts().sum()
print(SO_smaller["UndergradMajor"].value_counts()/total)
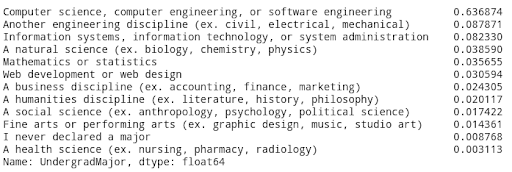
The above code just counts up the total number of respondents for each major, and then determines percentages:
We can now loop over the undergrad groupby element and print all the results:
for elem in SO_smaller.groupby("UndergradMajor"):
 print("For group: {}".format(elem[0]))
 total = elem[1]["AIDangerous"].value_counts().sum()
 print(elem[1]["AIDangerous"].value_counts()/total)
The “AIDangerous” has 4 different choices that could have been selected:
- Algorithms making important decisions
- Artificial intelligence surpassing human intelligence (“the singularity”)
- Evolving definitions of “fairness” in algorithmic versus human decisions
- Increasing automation of jobs
Which shows us that natural science/engineering graduates are mostly afraid of “algorithms making important decisions”, while social science graduates are afraid of “evolving definitions of fairness.”
5 — Plotting Data with Pandas
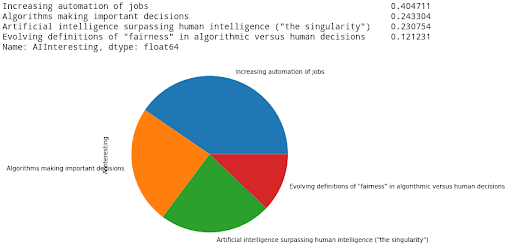
Another nice functionality of pandas is, it has many functions from the Python matplotlib library. One of them is the pie chart function. Let’s take a look at what Undergraduate Majors find interesting about AI. We can again use the groupby function on our dataset, this time on the UndergradMajor column. To make a pie-plot of what students find interesting about AI for the Computer Science undergraduate students, we can use the following code snippet.
groups = SO_smaller.groupby("UndergradMajor")
CS_group = groups.get_group("Computer science, computer engineering, or software engineering")
total = CS_group["AIInteresting"].value_counts().sum()
print(CS_group["AIInteresting"].value_counts()/total)
_ = CS_group["AIInteresting"].value_counts().plot.pie(figsize=(6,6))
Automation is the by far the most compelling benefit of AI for software and computing undergrads.
Conclusions
AI remains a controversial topic for the general public. But for the software and computer professionals that took the StackOverflow survey, AI represents a promising future. While certain groups had reservations about certain aspects of AI, overall all the respondents to the StackOverflow survey were uniformly positive about the future of AI.
Some of the reservations included:
- Women are statistically more likely than men to have concerns about AI.
- University arts graduates are wary of trusting AI to make decisions.
- AI helps make decisions in many industries that affect people’s health, finances, and more.
- University science grads are worried about AI bias.
- AI has been shown to be biased based on who programmed it, or how it’s developed.
There are many more insights to be pulled from the StackOverflow survey. To get started with your own analysis, sign up for a free ActiveState Platform account so you can download our Pandas Tutorial runtime environment and get started faster.
Related Reads


