Before we start: This Python tutorial is a part of our series of Python Package tutorials. You can find other Matplotlib related topics too!
This article focuses on how to clear a plot by clearing the current Axes and Figure state of a plot, without closing the plot window. There are two methods available for this purpose:
- clf() | class: matplotlib.pyplot.clf(). Used to clear the current Figure’s state without closing it.
- cla() | class: matplotlib.pyplot.cla(). Used to clear the current Axes state without closing it.
How to Clear a Pyplot Figure
Figure is the top-level container object in a matplotlib plot. Figure includes everything visualized in a plot, including one or more Axes.
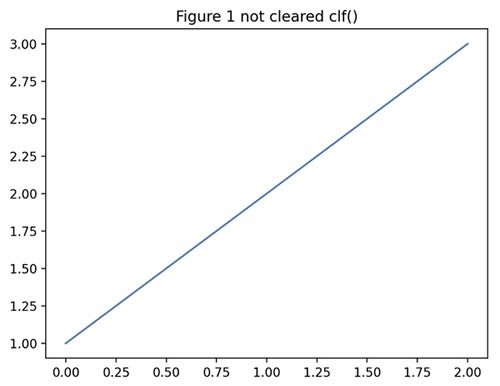
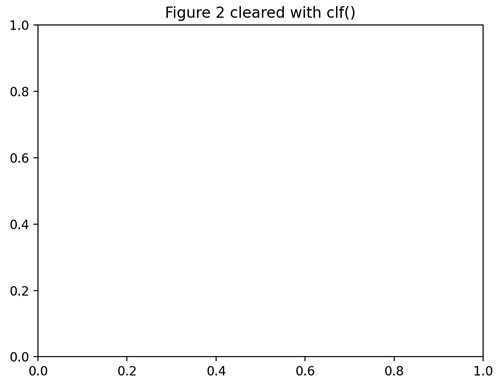
You can use the matplotlib.pyplot.clf() function to clear the current Figure’s state. The following example shows how to create two identical Figures simultaneously, and then apply the clf() function only to Figure 2:
import matplotlib.pyplot as plt
f1 = plt.figure()
plt.plot([1, 2, 3])
plt.title("Figure 1 not cleared clf()")
f2 = plt.figure()
plt.plot([1,2,3])
# Clear Figure 2 with clf() function:
plt.clf()
plt.title("Figure 2 cleared with clf()")
plt.show()
Figure 1. A Figure not cleared with the clf() function:
Figure 2. A Figure with the same elements cleared with the clf() function:
How to Clear Pyplot Axes
Axes is a container class within the top-level Figure container. It is the data plotting area in which most of the elements in a plot are located, including Axis, Tick, Line2D, Text, etc., and it also sets the coordinates. An Axes has at least an X-Axis and a Y-Axis, and may have a Z-Axis.
The matplotlib.pyplot.cla() function clears the current Axes state without closing the Axes. The elements within the Axes are not dropped, however the current Axes can be redrawn with commands in the same script.
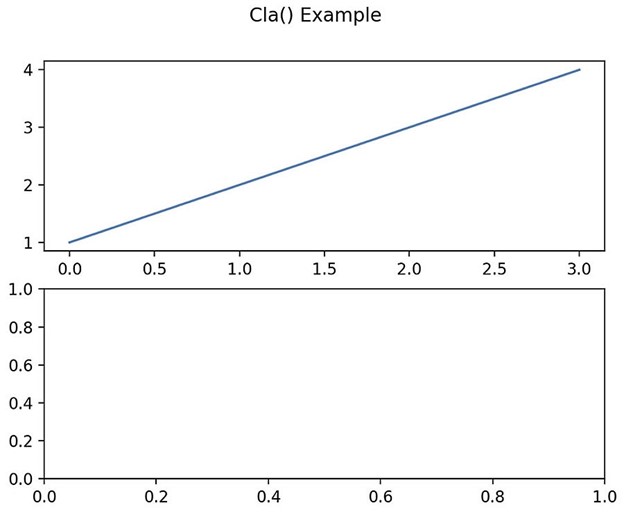
The following example creates a Figure and then plots two Axes in two different subplots. Only the second Axes is cleared with the cla() function:
import matplotlib.pyplot as plt
fig, [ax, ax1] = plt.subplots(2, 1)
ax.plot([1, 2, 3, 4])
ax1.plot([1, 2, 3, 4])
# cla() function clears the 2nd Axe:
ax1.cla()
fig.suptitle('Cla() Example')
plt.show()
Figure 3. A Figure containing two Axes in different subplots. The first Axes is not cleared with the cla() function. The second Axes is cleared with cla():
The following tutorials will provide you with step-by-step instructions on how to work with Matplotlib, including:
Use ActiveState Python and accelerate your Python Data Science projects.
ActiveState Python is 100% compatible with the open source Python distribution, and provides the security and commercial support that your organization requires.
With ActiveState Python you can explore and manipulate data, run statistical analysis, and deliver visualizations to share insights with your business users and executives sooner–no matter where your data lives.
- Download and install the pre-built “Data Plotting” runtime environment for Windows 10 or CentOS 7, or
- Build your own custom Python runtime with just the packages you’ll need for your Data Science / Machine Learning project, by creating a free ActiveState Platform account.


