Before we start: This Python tutorial is a part of our series of Python Package tutorials. You can find other Matplotlib related topics too!
Matplotlib is a cross-platform, data visualization and graphical plotting library (histograms, scatter plots, bar charts, etc) for Python and its numerical extension NumPy. As such, it offers a viable open source alternative to MATLAB. Developers can also use matplotlib’s APIs (Application Programming Interfaces) to embed plots in GUI applications.
A Python matplotlib script is structured so that a few lines of code are all that is required in most instances to generate a visual data plot. The matplotlib scripting layer overlays two APIs:
- The pyplot API is a hierarchy of Python code objects topped by matplotlib.pyplot
- An OO (Object-Oriented) API collection of objects that can be assembled with greater flexibility than pyplot. This API provides direct access to Matplotlib’s backend layers.
Matplotlib and Pyplot in Python
The pyplot API has a convenient MATLAB-style stateful interface. In fact, the matplotlib Python library was originally written as an open source alternative for MATLAB. The OO API and its interface is more customizable and powerful than pyplot, but considered more difficult to use. As a result, the pyplot interface is more commonly used, and is referred to by default in this article.
Understanding matplotlib’s pyplot API is key to understanding how to work with plots:
- matplotlib.pyplot.figure: Figure is the top-level container. It includes everything visualized in a plot including one or more Axes.
- matplotlib.pyplot.axes: Axes contain most of the elements in a plot: Axis, Tick, Line2D, Text, etc., and sets the coordinates. It is the area in which data is plotted. Axes include the X-Axis, Y-Axis, and possibly a Z-Axis, as well.
For more information about the pyplot API and interface, refer to What Is Pyplot In Matplotlib
Installing Matplotlib
Matplotlib and its dependencies can be downloaded as a binary (pre-compiled) package from the Python Package Index (PyPI), and installed with the following command:
python -m pip install matplotlib
Matplotlib is also available as uncompiled source files from GitHub. Compiling from source will require your local system to have the appropriate compiler for your OS, all dependencies, setup scripts, configuration files, and patches available. This can result in a fairly complex installation. Alternatively, consider using the ActiveState Platform to automatically build matplotlib from source and package it for your OS.
Matplotlib UI Menu
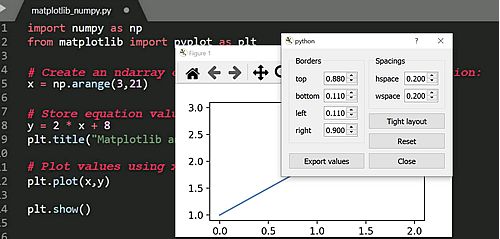
When matplotlib is used to create a plot, a User Interface (UI) and menu structure are generated. The UI can be used to customizing the plot, as well as to pan/zoom and toggle various elements.
Matplotlib and NumPy
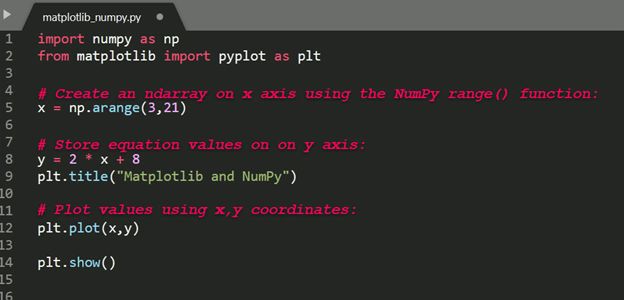
Numpy is a package for scientific computing. Numpy is a required dependency for matplotlib, which uses numpy functions for numerical data and multi-dimensional arrays as shown in the following code snippet:
The source code for this example is available in the Matplotlib: Plot a Numpy Array section further down in this article.
Matplotlib and Pandas
Pandas is a library used by matplotlib mainly for data manipulation and analysis. Pandas provides an in-memory 2D data table object called a Dataframe. Unlike numpy, pandas is not a required dependency of matplotlib.
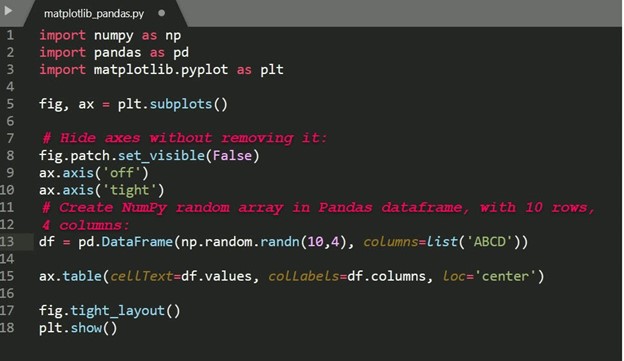
Pandas and numpy are often used together, as shown in the following code snippet:
The source code for this example is available in the Matplotlib: Plot a Pandas Dataframe section further down in this article.
How to Create Matplotlib Plots
This section shows how to create examples of different kinds of plots with matplotlib.
Matplotlib Line Plot
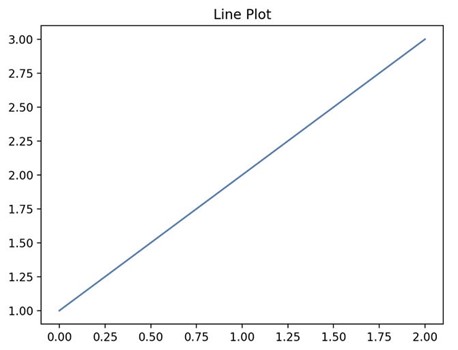
In this example, pyplot is imported as plt, and then used to plot three numbers in a straight line:
import matplotlib.pyplot as plt
# Plot some numbers:
plt.plot([1, 2, 3])
plt.title(”Line Plot”)
# Display the plot:
plt.show()
Figure 1. Line plot generated by Matplotlib:
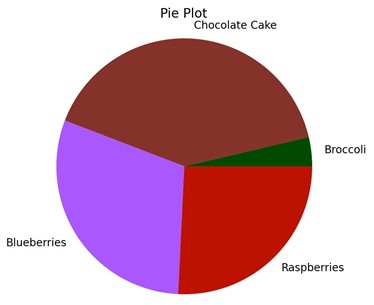
Matplotlib Pie Plot
In this example, pyplot is imported as plt, and then used to create a pie chart with four sections that have different axis labels (xlabel, ylabel), sizes and colors:
import matplotlib.pyplot as plt
# Data labels, sizes, and colors are defined:
labels = 'Broccoli', 'Chocolate Cake', 'Blueberries', 'Raspberries'
sizes = [30, 330, 245, 210]
colors = ['green', 'brown', 'blue', 'red']
# Data is plotted:
plt.pie(sizes, labels=labels, colors=colors)
plt.axis('equal')
plt.title(“Pie Plot”)
plt.show()
Figure 2. Pie plot generated by Matplotlib:
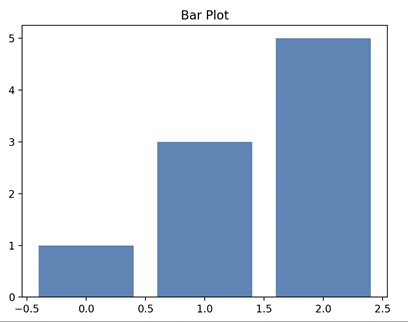
Matplotlib Bar Plot
In this example, pyplot is imported as plt, and then used to plot three vertical bar graphs:
import matplotlib.pyplot as plt
import numpy as np
# Create a Line2D instance with x and y data in sequences xdata, ydata:
# x data:
xdata=['A','B','C']
# y data:
ydata=[1,3,5]
plt.bar(range(len(xdata)),ydata)
plt.title(“Bar Plot”)
plt.show()
Figure 3. Bar plot generated by Matplotlib:
Matplotlib: Plot a Numpy Array
In this example, pyplot is imported as plt, and then used to plot a range of numbers stored in a numpy array:
import numpy as np
from matplotlib import pyplot as plt
# Create an ndarray on x axis using the numpy range() function:
x = np.arange(3,21)
# Store equation values on y axis:
y = 2 * x + 8
plt.title("NumPy Array Plot")
# Plot values using x,y coordinates:
plt.plot(x,y)
plt.show()
Matplotlib: Plot a Pandas DataFrame
In this example, pyplot is imported as plt, and then used to plot a pandas dataframe:
import numpy as np
import pandas as pd
import matplotlib.pyplot as plt
fig, ax = plt.subplots()
# Hide axes without removing it:
fig.patch.set_visible(False)
ax.axis('off')
ax.axis('tight')
# Create a numpy random array in a pandas dataframe with 10 rows, 4 columns:
df = pd.DataFrame(np.random.randn(10, 4), columns=list('ABCD'))
plt.title("Pandas Dataframe Plot")
ax.table(cellText=df.values, colLabels=df.columns, loc='center')
fig.tight_layout()
plt.show()
For more examples of how to create plots with matplotlib, refer to How To Display A Plot In Python
The following tutorials will provide you with step-by-step instructions on how to work with Matplotlib, including:
Why use ActiveState Python for Data Science
While the open source distribution of Python may be satisfactory for an individual, it doesn’t always meet the support, security, or platform requirements of large organizations.
This is why organizations choose ActiveState Python for their data science, big data processing, statistical analysis needs and Python programming needs.
Pre-bundled with the most important packages Data Scientists need, ActiveState Python is pre-compiled so you and your team don’t have to waste time configuring the open source distribution. You can focus on what’s important–spending more time building algorithms and predictive models against your big data sources, and less time on system configuration.
ActiveState Python is 100% compatible with the open source Python distribution, and provides the security and commercial support that your organization requires.
With ActiveState Python you can explore and manipulate data, run statistical analysis, perform Python plotting and deliver visualizations to share insights with your business users and executives sooner–no matter where your data lives.
Some Popular Python Packages You Get Pre-compiled – with ActiveState Python for Data Science/Big Data/Machine Learning
- pandas (data analysis)
- NumPy (multi-dimensional arrays)
- SciPy (algorithms to use with numpy)
- HDF5 (store & manipulate data)
- Matplotlib (data visualization)
- Jupyter Notebook (research collaboration)
- PyTables (managing HDF5 datasets)
- HDFS (C/C++ wrapper for Hadoop)
- pymongo (MongoDB driver)
- SQLAlchemy (Python SQL Toolkit)
- redis (Redis access libraries)
- pyMySQL (MySQL connector)
- scikit-learn (machine learning)
- TensorFlow (deep learning with neural networks)
- scikit-learn (machine learning algorithms)
- keras (high-level neural networks API)
Download ActiveState Python to get started or contact us to learn more about using ActiveState Python in your organization.


